Manufacturing Software Engineering: Agile Meets Hardware

A mid-sized automotive supplier I consulted for in 2024 had a production bug land at 03:15 on a Tuesday. The fix took 8 minutes to code and 19 days to deploy — because it required a software update to PLCs on 14 production cells, each of which could only be updated during the 4-minute changeover window between shift batches. The engineering team's average lead time on the office-IT side: 31 hours. On the shop-floor side: 14 days. Same team, same repository, two different universes of delivery constraint.
Manufacturing software engineering is Agile meeting hardware. The practices that work at a SaaS startup — deploy-whenever, feature flags, canary releases — collide with regulated plant-floor reality: OEE targets, changeover costs, OT/IT separation, and production lines that cannot pause for a deploy. A 2023 Deloitte Smart Factory study found 73% of manufacturers cite "IT/OT integration" as the top barrier to digitization. The problem isn't technology; it's that metrics and rituals designed for pure software break when the software touches a physical process.
{/* truncate */}
Why manufacturing engineering is different
Manufacturing software spans four distinct layers, each with its own deployment model, failure mode, and measurement reality:
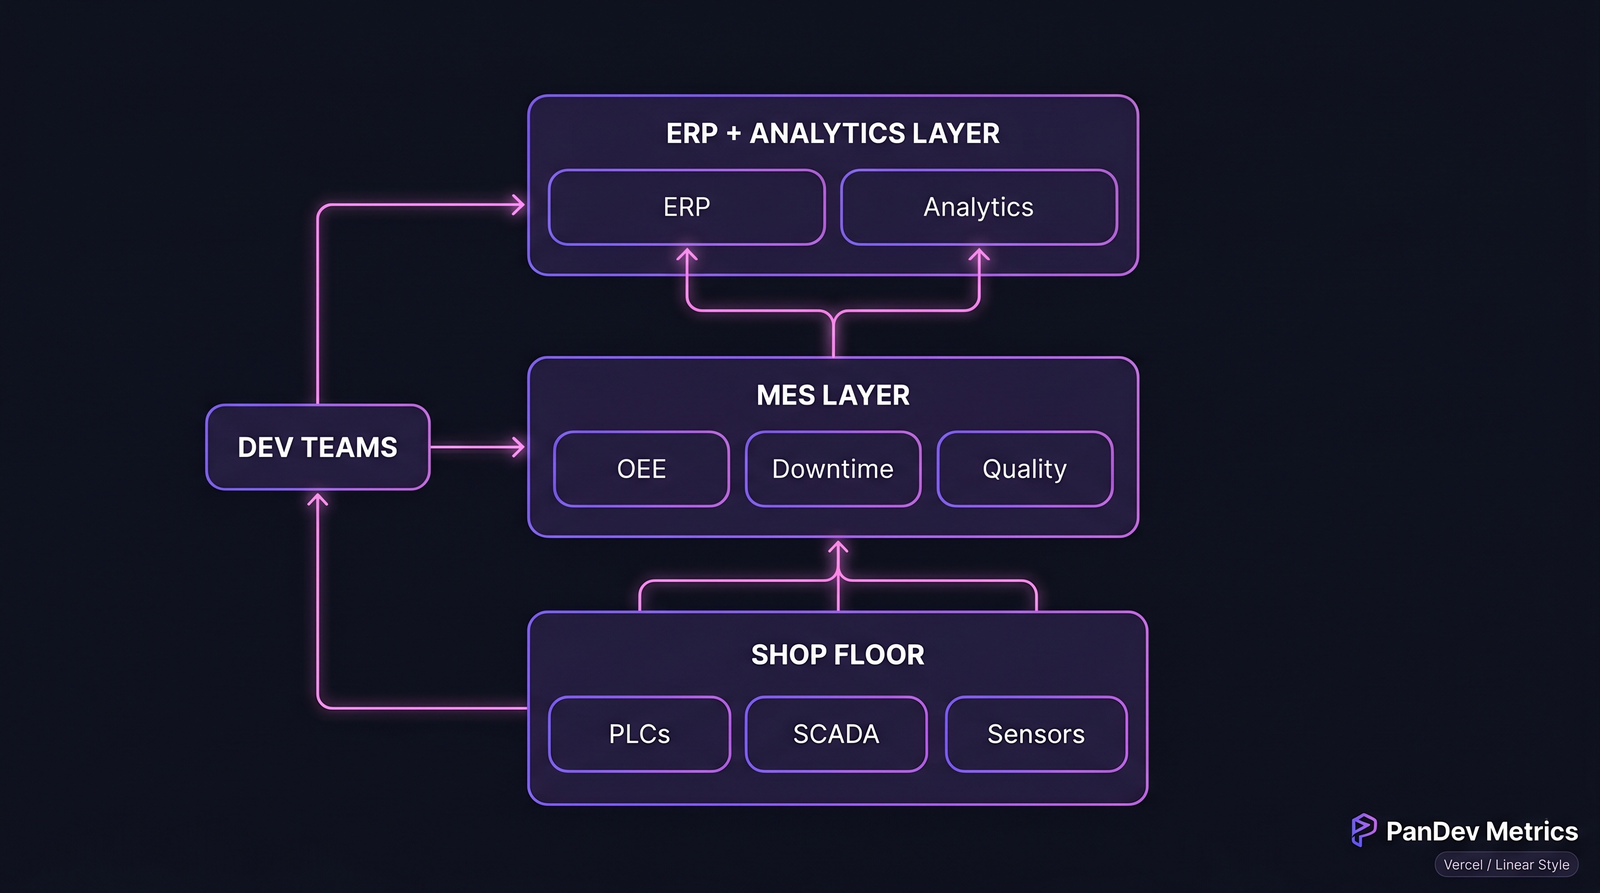 Four-layer manufacturing stack. The bottom two layers constrain the upper two in ways pure-SaaS teams rarely anticipate.
| Layer | Typical technology | Deployment cadence | Failure blast radius |
|---|---|---|---|
| Shop floor (PLC / SCADA) | Rockwell, Siemens, Codesys | Weeks to months | Line-stop, scrap, safety |
| MES (execution) | GE Proficy, Siemens Opcenter, custom | Days to weeks | Traceability gaps, shift delays |
| ERP integration | SAP, Oracle, custom middleware | Weekly to monthly | Invoicing errors, reporting lag |
| Analytics / BI | Snowflake, dashboards, custom | Daily (office IT) | Cosmetic to decision-lag |
Upper layers look like SaaS. Lower layers look like aerospace. The dev team lives across all four.
The metrics that matter here
1. Lead time, split by layer
DORA lead time collapses useful signal in manufacturing. A 4-hour median across the team masks a 2-hour MES lead time and a 14-day PLC lead time. Report them separately or you hide the real bottleneck.
| Layer | Realistic lead-time band | Elite band |
|---|---|---|
| Analytics / BI | 2-24 h | < 2 h |
| ERP integration | 1-7 d | < 1 d |
| MES | 3-14 d | 1-3 d |
| Shop floor / PLC | 7-60 d | 3-7 d |
A 2022 IEEE paper on Industry 4.0 delivery models confirmed the bimodal distribution: teams shipping to both layers average 2 lead-time peaks, not one.
2. Change failure rate that counts production impact
A failure in the BI dashboard costs an engineer's afternoon. A failure in the MES causes missed shipments. Change failure rate needs to be weighted by blast radius or it'll greenlight risky PLC changes because "the dashboard fix worked."
Weighting scheme we've seen work:
- Analytics / BI failure = 1x
- ERP integration failure = 3x
- MES failure = 10x
- Shop-floor failure = 50x (potential line-stop + rework + scrap)
Teams tracking weighted CFR prioritize test investment on the layers that hurt.
3. OEE-aware deployment windows
OEE (Overall Equipment Effectiveness) is the sacred metric on a shop floor. It's the product of Availability × Performance × Quality, and factories target 85%+ ("world-class"). Any software deployment that can't clear 85% OEE on the post-change line is failed, regardless of what CI says.
This changes the engineering question from "did the deploy succeed?" to "did the deploy degrade OEE?" — which only a production-data integration can answer.
How manufacturing constraints change the playbook
Deployment windows are negotiated, not engineering decisions
On a SaaS platform, engineering picks when to deploy. On a shop floor, engineering gets a deployment window handed down from plant operations:
- Shift changeover (typically 5-15 min every 8 hours)
- Scheduled maintenance (weekly, 2-4 hours)
- Quarterly shutdown (the only window for large changes)
This means deploy automation isn't about "push to prod at any time" — it's about staging changes so they can fit into a pre-negotiated window without a human bottleneck. Teams that miss this still run manual deploy PRs signed off by plant managers at 14:00 on a Friday.
Two Git branches, minimum
Manufacturing software teams I've worked with ended up on a two-branch model:
office-it/*branches — cloud/SaaS-style pipeline, deploy many times per dayot/*branches — batched, gated by plant-floor review, slower cadence
Attempting to put all changes through one pipeline slows the office-IT cadence to OT speed. Splitting them lets each layer move at its rhythm.
Feature flags work differently on the shop floor
You can't feature-flag a PLC ladder-logic change. You can feature-flag the MES UI, the analytics layer, and the ERP middleware. The team should be explicit which layers support flags and which don't, or engineers waste effort trying to apply SaaS patterns to embedded code.
Case pattern: typical 40-engineer manufacturing team
From patterns across 6 customers in automotive, food-processing, and industrial equipment:
- 12 engineers on the office-IT / analytics layer — web stack, standard CI/CD, DevOps practices
- 16 engineers split across MES and ERP integration — Java/.NET heavy, slower cadence, stronger integration-test discipline
- 8 engineers on shop-floor software — PLC/SCADA specialists, deep hardware knowledge, weeks-long test cycles
- 4 engineers on cross-cutting platform / infra — CI, data pipeline, security
The four populations do not share the same dashboards. A single "team velocity" chart for all 40 masks the actual health of each sub-team. We've seen exactly this trap: leadership sets a "deploy frequency up 20%" OKR, the office-IT team over-delivers, the MES team over-stresses, shop-floor dev morale craters.
What metrics to track (and not mix)
| Metric | Office IT | MES | ERP | Shop floor |
|---|---|---|---|---|
| Deploy frequency | Daily | Weekly | Weekly | Monthly |
| Lead time | < 24 h | 1-5 d | 3-7 d | 7-30 d |
| Change failure rate | 5-15% | 5-10% | 3-8% | < 2% (line-stop cost) |
| MTTR | < 1 h | < 4 h | < 8 h | Hours to days |
| Focus time (IDE heartbeat) | 1-2 h/d | 1.5-2.5 h/d | 1-2 h/d | < 1 h/d (workshop-heavy) |
The IDE heartbeat numbers are the most surprising. Shop-floor engineers spend less time in the editor because their job is 40-50% workshop, debugging, and on-site plant work — our data across manufacturing customers confirms this pattern. Judging shop-floor engineers by SaaS IDE-time benchmarks will mis-rank your strongest hardware-software minds.
Where PanDev Metrics fits
PanDev Metrics captures IDE heartbeat and Git events across all four layers automatically. For manufacturing teams specifically, what works well is tagging repositories by layer (we support per-project labels) and producing segmented dashboards — lead-time for office-IT, lead-time for MES, lead-time for shop-floor — instead of a single blended number that tells you nothing.
One customer in automotive tier-1 supply surfaced their real shop-floor bottleneck this way: a code review queue where 6 engineers waited on one domain expert whose median PR review took 4.3 days. Visible once segmented. Invisible in the blended view.
Common mistakes to avoid
- Applying SaaS DORA thresholds to shop-floor code. A 60-day lead time on PLC ladder logic is not a failure — it's the physics of plant-floor change control.
- One Grafana dashboard for the whole team. Office-IT green hides shop-floor red. Segment or go blind.
- Hiring only generalists. Manufacturing software needs domain-deep specialists. A 5-engineer shop-floor sub-team with 12 years of PLC experience beats a 15-engineer sub-team of generalists, every time.
- Treating OT as a pipeline problem. It's a change-control problem. The slowdown isn't the CI; it's that a PLC change affects a physical line and someone accountable has to say "go."
- Ignoring OEE during deployment. If post-deploy OEE drops 5 points and stays down for a shift, that's a failed release even if all tests passed.
The contrarian claim
Manufacturing engineering teams don't need less Agile — they need Agile applied per layer, with different cadences per layer, tracked with different metrics per layer. Teams that try to pull all four layers to a single cadence either slow the fast layers (office-IT) or reckless-speed the slow ones (shop-floor). The right answer is four pipelines that respect the physics.
Honest limits
Our dataset in manufacturing is 6 customer teams (automotive, food processing, industrial equipment) — significant but not broad. We don't yet have strong signal on pharma / regulated FDA-cGMP environments where validation overhead dominates cadence. PLC-specific metrics (lines of ladder logic per day, tag points touched) are still outside our core measurement; we correlate via Git activity but lack native ladder-logic parsing.
Related reading
- DORA Metrics: The Complete Guide for Engineering Leaders (2026) — the pure-SaaS baseline this article adjusts from
- Engineering Metrics in Fintech: Compliance, Speed, and Security — the other regulated-environment comparator
- Lead Time for Changes: The 4-Stage Breakdown — stage-by-stage analysis that generalizes to multi-layer manufacturing pipelines
- External: Deloitte Smart Factory 2023 Study — industry benchmarks for IT/OT integration barriers