Marketplace Engineering: Metrics for Two-Sided Products

A marketplace CTO told me the line I keep hearing: "My supply team ships fast, my demand team ships fast, and GMV still stagnates." The DORA dashboards were green on both sides. The matching engine was not. Two-sided products have a metric gap that single-sided SaaS doesn't: engineering output on one side of the marketplace only creates business value if it's matched by output on the other side.
Andreessen Horowitz's marketplace framework ranks liquidity — the probability that a listed item actually transacts within a window — as the single best predictor of marketplace health. That probability is an engineering outcome, not a marketing one. When search latency rises by 200ms, listed-item conversion drops measurably. When seller onboarding takes 14 days instead of 4, supply growth curves flatten within a quarter.
{/* truncate */}
Why marketplace engineering is different
Single-sided SaaS ships features to one audience and measures the result in activation, retention, and revenue per user. A marketplace ships to two audiences simultaneously and measures the result in matched transactions. The failure mode is asymmetry: a feature that helps supply but doesn't help demand (or vice versa) can look like a win on one side while breaking the economic loop.
Three engineering consequences follow:
Release coordination is a first-class concern. A search-ranking change on the demand side can invalidate the merchandising playbook on the supply side if sellers aren't notified. Deploy independence doesn't buy you as much as it does in single-sided products — you still need release gates that consider both audiences.
Latency on either side is a conversion tax. Google's SOASTA / Akamai research established that every 100ms of mobile-load delay cuts conversion by 7%. On marketplaces this hits twice — once on the seller's listing-upload flow and once on the buyer's search flow — and the two compound across the funnel.
Trust-and-safety is engineering infrastructure, not an ops team. The number of content-moderation, fraud, and dispute-resolution engineers on a marketplace is a structural cost, and it scales with GMV, not with headcount. Airbnb, Etsy, and Uber's published engineering blogs all describe trust-and-safety platforms that are larger than their core product platforms by year five.
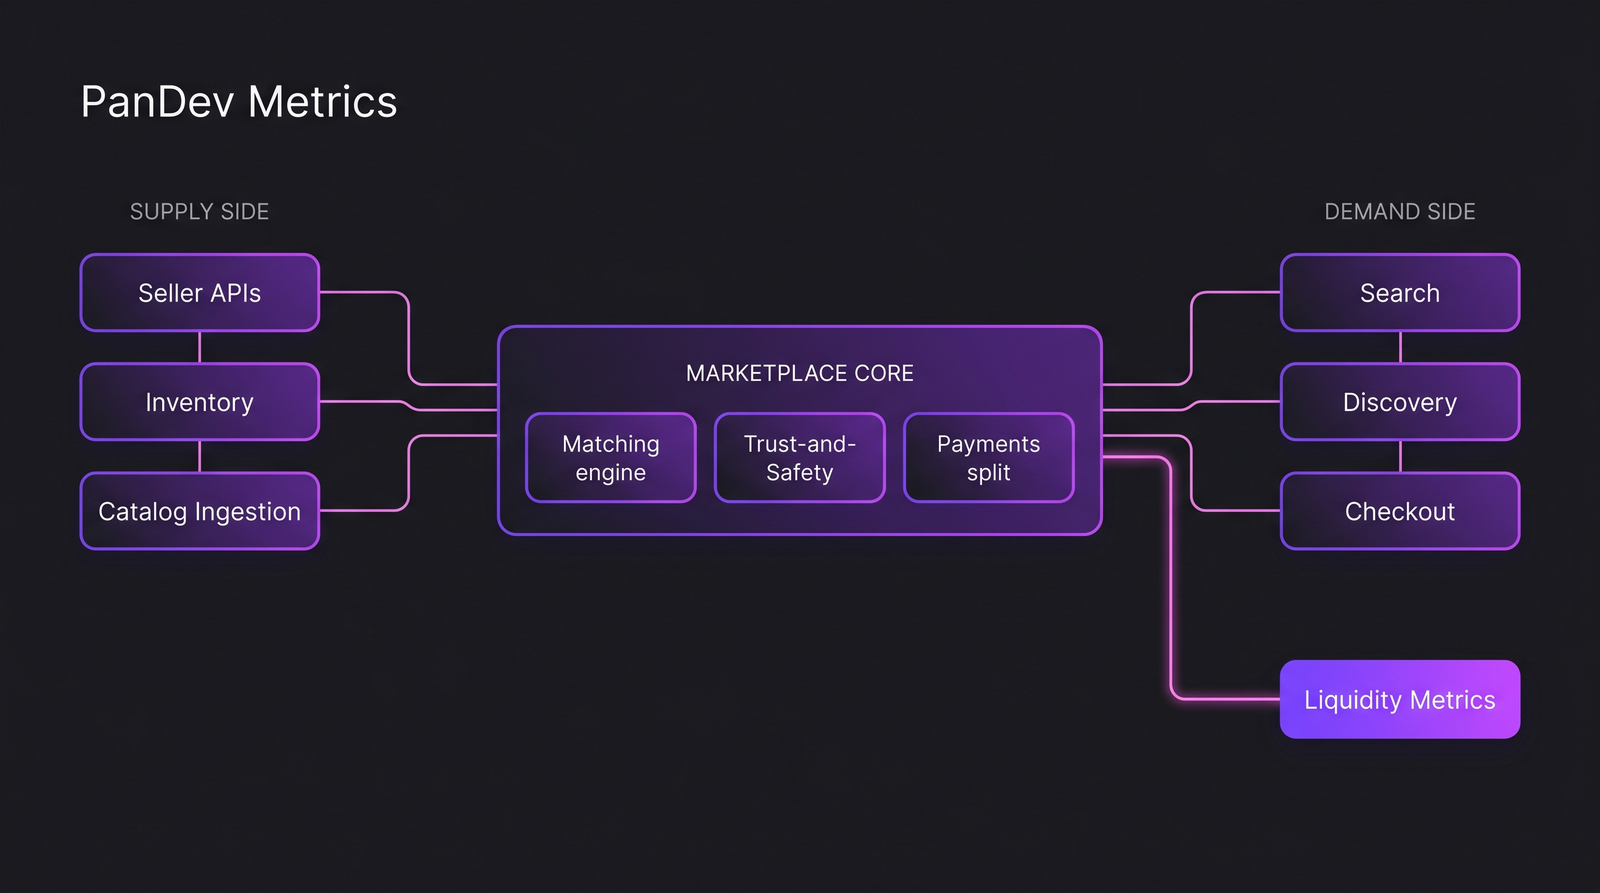 The supply and demand pipelines look symmetrical on paper. In practice they diverge sharply in failure modes and deployment cadence.
The 5 metrics that matter on two-sided products
1. Supply-demand deploy ratio
Track what fraction of engineering deploys ship to supply-side services vs demand-side services. Healthy marketplaces tend to land between 40/60 and 60/40. When one side drifts below 30%, you're compounding an imbalance that will show up in liquidity metrics 2-3 quarters later.
| Platform maturity | Typical supply-side deploy share | Typical demand-side deploy share |
|---|---|---|
| Pre-liquidity (Year 1-2) | 55-70% | 30-45% |
| Liquidity-stable (Year 3-5) | 40-55% | 45-60% |
| Category-leader (Year 6+) | 35-45% | 35-45% (rest goes to T&S / platform) |
The asymmetry in early years is correct — supply is usually the hard side — but once liquidity is established, a persistent tilt is a scaling smell.
2. Matching-latency P95
Not search latency. Matching latency: the time from a buyer's query to a ranked list of relevant supply items. This includes query parsing, retrieval from the inverted index, re-ranking (often ML-driven), merchandising, and response assembly. Published benchmarks:
| Marketplace vertical | P95 matching latency (acceptable) | P95 that kills conversion |
|---|---|---|
| Ride-sharing (real-time) | < 300ms | > 800ms |
| E-commerce search | < 400ms | > 1.2s |
| Services marketplace | < 600ms | > 2s |
| B2B / enterprise | < 1s | > 3s |
The kill-conversion threshold is where you see buyer drop-off exceed 5% compared to median-latency sessions. Instrumenting this requires session-level tracing across the search stack — not a single service SLO.
3. Supply onboarding time
Clock starts when a new seller hits the sign-up form. Clock stops when they have at least one listed, discoverable item. This is mostly an engineering metric — verification APIs, KYC pipelines, listing-quality checks, image moderation, category mapping — and it's the most neglected metric on most marketplace dashboards.
DoorDash published internally that cutting merchant onboarding from 14 days to 4 days drove a 31% increase in first-90-day GMV per merchant. The engineering work was almost entirely on the verification + catalog-ingestion path.
4. Trust-and-safety MTTR (content / fraud / dispute)
Standard MTTR measures how fast you restore a system after an incident. T&S MTTR measures how fast you remove harmful content, reverse a fraudulent transaction, or resolve a disputed order. Our MTTR primer argues that recovery speed matters more than prevention frequency — that's doubly true on marketplaces, where zero-fraud systems don't exist.
Benchmark targets (from public post-mortems + industry reports):
| T&S event type | Target MTTR | Red-flag MTTR |
|---|---|---|
| Counterfeit listing (reported) | < 2h | > 24h |
| Suspected payment fraud (automated flag) | < 10min | > 2h |
| Account takeover (reported) | < 30min | > 4h |
| Dispute resolution (buyer vs seller) | < 72h | > 14d |
The engineering investment that moves these numbers is usually workflow tooling for the T&S ops team, not ML alone. Most marketplaces under-invest here until their first public incident.
5. Listing-to-first-transaction time
Supply-side funnel metric that's mostly engineering. From the moment a seller uploads a valid listing, how long until that listing records its first completed transaction? The distribution is usually long-tailed, so the useful statistic is the median (most sellers care whether their average item gets discovered) and the P90 (how long is the tail for non-discovered items).
Liquidity is meaningless in aggregate if 30% of listings never get a single view. The engineering teams that own search recall, cold-start ranking, and merchandising placement are the ones moving this metric. A quarterly review of listing-to-first-transaction distribution catches ranking-model drift earlier than click-through-rate dashboards do.
How compliance and scale shift the toolchain
Marketplaces operating across jurisdictions face a compounding engineering burden:
Payments fragmentation. Splitting a transaction between buyer, seller, platform fee, tax, and (often) local compliance escrow means your payments service handles 5+ leg journal entries per order. Stripe Connect, Adyen MarketPay, and Mangopay exist because the naive "charge the buyer, pay the seller" pattern breaks the moment you operate in multiple tax jurisdictions.
Data residency for reviews and PII. User-generated reviews, dispute messages, and KYC documents are personal data. GDPR, CCPA, Kazakhstan's personal-data law, and Russia's 152-FZ impose different residency rules. Marketplaces at scale often run region-partitioned databases — and the engineering-metrics platform that measures those teams has to handle the same residency constraints. This is one of the practical reasons marketplace customers at PanDev Metrics tend to choose our on-prem Docker or Kubernetes deployment over cloud.
Search relevance is an engineering discipline, not a data-science project. The gap between "we shipped an ML model" and "ranking drift detection is on-call rotation" is a 12-18 month engineering investment. Teams that skip it get random conversion spikes and drops they can't explain.
Case pattern: typical marketplace engineering team
| Parameter | Horizontal marketplace (Year 4-7) | Vertical marketplace (Year 4-7) |
|---|---|---|
| Team size | 150-400 engineers | 40-150 engineers |
| Supply-side sub-team | 25-40% of eng | 30-45% of eng |
| Demand-side sub-team | 25-35% of eng | 20-30% of eng |
| Trust & safety eng | 10-15% of eng | 8-12% of eng |
| Platform / infra | 15-25% of eng | 15-20% of eng |
| Deploy cadence | Daily per service | Daily per service |
| Primary toolchain | Go or Java services, Elasticsearch / OpenSearch, Kafka, Postgres + Redis, ML platform (Kubeflow / internal) |
A vertical marketplace (Reverb for guitars, Chewy for pet supplies, StockX for sneakers) can operate with a leaner team because catalog complexity is bounded. Horizontal marketplaces (eBay, Etsy, Amazon, Ozon, Wildberries) absorb the full complexity of a category-agnostic platform and pay for it in engineering headcount.
The contrarian take
Most marketplace engineering leaders over-optimize for the launch side and under-invest in the mature side. The founder playbook says "supply is the hard side" — it's true in year 1. By year 4, the hard side is usually trust-and-safety at scale. Teams that are still organized around a supply/demand binary at that point are understaffing the T&S investment that prevents the one public incident that tanks marketplace trust for a year.
The teams that get ahead of this reorganize at around 100 engineers: supply, demand, and trust-and-safety as a peer pillar, with its own OKRs and its own deploy cadence. The ones that don't discover the need during their first major fraud ring.
The honest limit
Our engineering-telemetry dataset skews toward B2B SaaS and agency customers. We have meaningful signal on about 15 marketplace teams across Kazakhstan, Russia, and adjacent CIS markets, plus a handful in the EU. The benchmarks for matching latency and T&S MTTR above come from a mix of our customer data, published engineering blogs (Airbnb, DoorDash, Uber), and the a16z marketplace dataset. Teams in hyperlocal geographies, regulated verticals (healthcare marketplaces, financial marketplaces), or truly global horizontal platforms will see meaningfully different shapes; treat the numbers above as starting points for your own measurement, not as universal law.
Where PanDev Metrics fits
Marketplace engineering teams at 100+ engineers tend to have the classic problem of aggregate DORA scores hiding per-team reality. The IDE heartbeat telemetry combined with Git + task-tracker signals lets you produce per-pillar (supply / demand / T&S / platform) dashboards from the same underlying dataset, rather than asking each team to instrument separately. The one setup requirement — branch names with task IDs — is a workflow habit most marketplace teams already follow because catalog / order-system changes are audit-sensitive by default.
Related reading
- DORA Metrics: The Complete Guide for Engineering Leaders — the single-sided baseline before you start segmenting by marketplace pillar
- E-Commerce: How to Accelerate Feature Delivery Before High Season — adjacent retail context with overlapping demand-side constraints
- MTTR: Why Speed of Recovery Matters More Than Preventing All Incidents — the recovery-focused mindset that maps cleanly onto T&S response times
- External: a16z Marketplace 100 methodology — the clearest public framework for ranking marketplace health