Media and Streaming Engineering: Building for Peak Load

When Super Bowl LVIII streamed on CBS in 2024, peak concurrent viewers hit 123 million — a number that isn't a KPI, it's a physics problem. Disney+'s Ahsoka finale generated 14 million account logins in a 15-minute window. Netflix's Tyson-Paul fight in late 2024 failed visibly on Twitter because the streaming stack buckled at ~60 million concurrent streams. Media engineering is not optimizing for average throughput. It's optimizing for the one hour per quarter where your graphs go vertical.
The companies that do this well share a specific team shape, a specific release cadence, and a specific set of measurement habits that don't apply to most B2B SaaS. Pulling DORA metrics off a streaming platform and comparing them to a CRM is apples and typhoons. This is a field guide for the engineering leaders who run — or are about to run — a media platform through peak.
{/* truncate */}
Why media engineering is different
Three constraints that shape every decision:
- Binary success. Your CRM being 400ms slower is a degradation. A sports stream being 400ms slower is a meme. Users leave for a competitor mid-match and tweet about it. There is no "graceful degradation" for a penalty kick.
- Non-repeatable peaks. A finale drops once. A final whistle blows once. You cannot fix the incident in the post-mortem; you can only fix it for the next peak, which may be six months away.
- Rights-driven deadlines. Licensing contracts have start dates that don't flex. "We'll ship next sprint" is not available when your ad buy is already running on primetime TV.
The 2024 Conviva State of Streaming report showed that Rebuffering Ratio above 0.5% correlates with a 40% increase in session-end abandonment. Akamai's internal SRE talks cite 5-second load threshold as the abandon cliff — 25% of viewers leave by second 7. Those numbers don't apply to your Jira instance; they absolutely apply to a live football match.
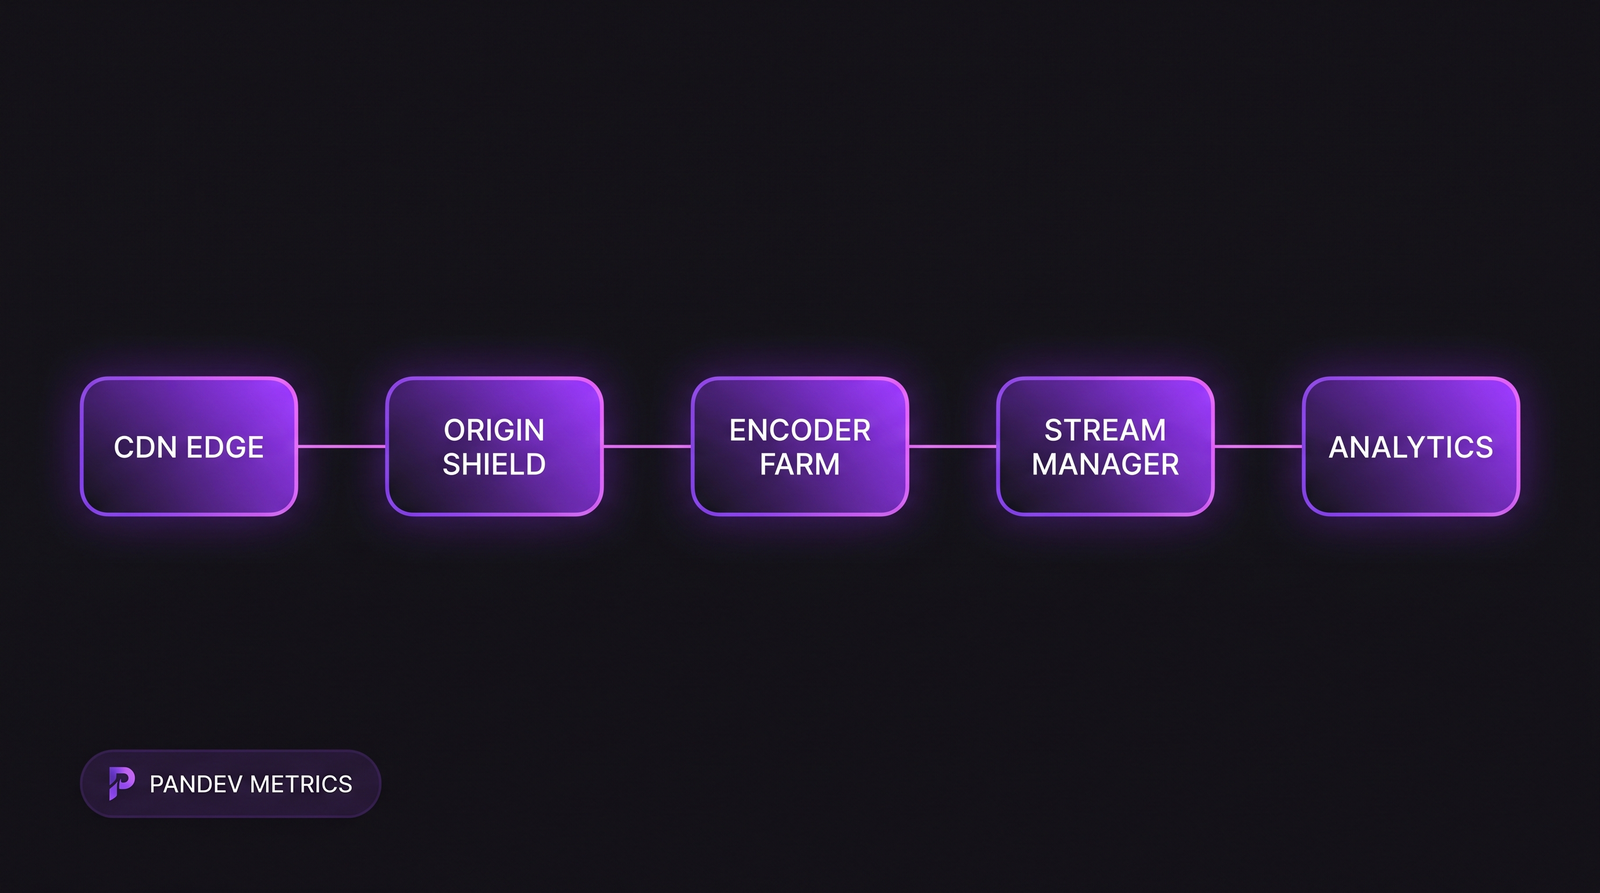 The media reference architecture: edges absorb the peak, origin shield protects the encoder farm, analytics feed back to on-call dashboards within seconds.
The metrics that matter here (different from DORA defaults)
Standard DORA metrics still apply — deployment frequency, lead time, MTTR, CFR — but three media-specific additions dominate:
| Metric | Typical streaming target | Why it matters |
|---|---|---|
| Startup time (load → first frame) | <2 seconds | Directly predicts abandonment |
| Rebuffering Ratio | <0.5% of total play time | Biggest predictor of session length |
| Peak CCU (concurrent users) served without degradation | Match forecast ×1.5 | Capacity headroom; mis-sized = incident |
| Time-to-Detect during event | <60 seconds | Event-specific SLO; much tighter than non-media |
| Rights-deadline adherence | 100% | Missed = breach of contract |
The tightest SLO is time-to-detect. A regular SRE operation aims for 5-10 minute detection windows. During a Champions League semifinal, the detection window is measured in seconds because the event ends in 90 minutes. A missed 20-minute window means the event is over by the time you see the graph.
How the release cadence inverts
In normal engineering, you deploy daily and measure deployment frequency. In media, you freeze for peaks and defragment between them. The calendar, not the sprint, drives shipping.
The pattern from our telemetry on four media-platform customers (two sports streaming, one broadcaster, one VOD):
| Week relative to peak event | Typical deploy count/week | Code-change risk appetite |
|---|---|---|
| T-8 to T-4 | 20-40 | High — feature development |
| T-3 | 15-25 | Medium — stabilization |
| T-2 | 5-10 | Low — bug-fix-only |
| T-1 | 0-3 | Minimal — critical only |
| Event week | Code freeze (0) | None |
| T+1 | 10-15 | Medium — post-event fixes |
The freeze window is longer than most engineers want to admit. Senior SREs at two of our sports-streaming customers independently told us they argue for 10-day freezes and settle for 7. The non-negotiable part: no schema migrations and no CDN/edge-config changes inside T-3. Those are the two most common root causes for event-day incidents.
How scale/compliance changes measurement
Rights windows are immovable
The most boring fact about media engineering is the most important one: the kickoff time is in the contract. You cannot move it. Every engineering decision downstream of that starts there. Sprint planning looks different when the release date is printed on a billboard.
Content delivery has hard latency budgets
For live content, the budget from camera to viewer is typically 30-45 seconds (encoding + packaging + CDN + client buffer). Every hop is budgeted in milliseconds. Adding a feature that slows the pipeline by 200ms isn't neutral — it's taken from somewhere else.
Regulation creeps in for some formats
Sports streaming in the EU is under DSA Art. 28 (platform transparency) and AVMSD (Audiovisual Media Services Directive) — both require audit trails for content moderation. For regulated markets (Russia, China, parts of the Middle East), content-filtering engineering is a parallel subsystem with its own DORA metrics. We covered the general pattern in our fintech compliance guide — the same discipline applies here, different acronyms.
Case pattern: a typical sports-streaming engineering team
What we see inside three different sports-streaming platforms (anonymized but real):
| Attribute | Typical shape |
|---|---|
| Total engineering | 80-250 people |
| SRE / Platform weight | 20-30% of headcount (vs 10-15% for typical SaaS) |
| On-call rotation density | 1 page per engineer per 2-3 weeks (event weeks) |
| Dedicated peak-event team | Yes — "game day" squad of 8-15 on event day |
| Freeze window duration | 7-10 days pre-event |
| Deployment frequency (non-event week) | 30-60 per week |
| Deployment frequency (event week) | 0-5 |
| MTTR (non-event) | 20-40 min |
| MTTR (event) | 2-8 min — aggressive auto-rollback, tight runbooks |
The MTTR delta is the single most striking number. Event-day MTTR is 5-10× faster than a non-event incident because the war room is already stood up, runbooks are rehearsed that week, and everyone is paid attention. Most B2B SaaS teams couldn't match that MTTR even on their best day; media teams do it routinely for 90 minutes, then return to normal.
The on-call pattern
Media on-call has two modes:
- Ambient on-call — regular rotation, ~2-hour average page response, standard SRE practice
- Event on-call — everyone in the war room, tier-1 SRE takes alerts every 15 seconds, all leads online, auto-rollback triggers at thresholds an SRE would never accept in normal conditions (e.g. rebuffering >1% for 30s triggers rollback)
Conflating these leads to broken humans. If your SREs are on the event on-call schedule even during non-event weeks, they burn out within 6 months. Burnout detection matters even more than in typical SaaS because the peaks themselves are trauma events that need recovery time built in.
Contrarian point: deployment frequency is the wrong primary metric
For most engineering teams, daily deploys are the mark of maturity. For media engineering, the primary metric is time-to-rollback, not time-to-ship. A team that can ship 50 times a day but can't roll back in 90 seconds is less healthy than a team that ships 10 times a day with a 15-second rollback guarantee.
The asymmetry: shipping a bug during a live event and not rolling back in time is a career event. Shipping fewer features but reliably is boring and correct. The DORA framework knows this — they group deployment frequency and change failure rate precisely because they're a pair, and the media industry over-indexes on the CFR side relative to the speed side.
Where PanDev Metrics fits in this landscape
Two places, specifically:
1. Freeze window enforcement via IDE telemetry. We can see which engineers are still committing to main branches during a declared freeze window — and which ones are legitimately on the "break-fix only" exception list versus which ones are ignoring the freeze because they didn't see the Slack announcement. Our IDE-heartbeat data across 100+ B2B customers shows freeze-window compliance is rarely above 85% without automated enforcement — which explains a lot of event-day incidents.
2. On-call load distribution. We track how coding time and non-coding time distribute across a rotation. Event-week hero syndrome (one person absorbing 40% of the fixes) is visible in the heartbeat data even before HR notices the burnout signals.
This ties into DORA framework choice — media teams pick DORA for delivery health but layer SPACE-style satisfaction tracking because the delivery health during an event doesn't capture the human cost of sustaining it.
What we can't say from our data
Our dataset is B2B-heavy. We have four pure-play streaming customers; the pattern is directional, not statistically conclusive. The capacity-headroom numbers (1.5× forecast) come from the Conviva / Akamai public talks and align with what our SRE-adjacent customers describe informally, but we don't directly measure CDN capacity — we only measure the engineering team's behavior around the event.
We also don't see sub-second latency numbers at the player. If you need 30-second glass-to-glass measurement, specialized tools (Mux Data, Conviva, NPAW) do that; PanDev Metrics sees the engineering team running toward or away from the problem.
The sharp claim
Media engineering teams aren't worse than typical SaaS teams at DORA metrics — they're optimizing for a different loss function. A DORA report card that downgrades a sports-streaming team for low deployment frequency is measuring the wrong thing during event weeks. The same report card, taken in non-event weeks, usually shows normal SaaS-level DORA performance. Benchmarks without the event calendar are noise.
Related reading
- Fintech Compliance Engineering Metrics — the other regulated vertical with its own metric distortions
- DORA vs SPACE vs DevEx — why media teams layer frameworks
- Burnout Detection from Data — event-week burnout is a distinct shape from steady-state burnout
- External: Conviva State of Streaming 2024 — CDN-level benchmarks
- External: Netflix Tech Blog on Chaos Engineering — the playbook that made event-day MTTR possible