Engineering Metrics Without Toxicity: How to Track Productivity Without Creating a Panopticon

The Stack Overflow Developer Survey consistently shows that developer autonomy and trust are among the strongest predictors of job satisfaction — yet most metrics implementations ignore this entirely. On one side, leaders who want to understand and improve their teams' performance. On the other, developers who hear "we're implementing metrics" and immediately think "Big Brother." Both sides have valid concerns. The question isn't whether to measure — it's how to measure without destroying the culture you're trying to improve.
{/* truncate */}
The Toxicity Spectrum
Not all metrics implementations are equal. Here's the spectrum from healthy to toxic:
| Level | Description | Example | Impact |
|---|---|---|---|
| Healthy | Team-level trends inform decisions | "Our team's Focus Time dropped — let's review the meeting calendar" | Positive: better environment |
| Cautious | Individual data discussed collaboratively | "Your PR cycle time is up — what's blocking you?" | Neutral to positive if done with trust |
| Risky | Individual rankings shared with management | "Here's the developer productivity leaderboard" | Negative: competition over collaboration |
| Toxic | Metrics used punitively | "Your coding hours are below average — we need to discuss your performance" | Destructive: gaming, fear, attrition |
| Panopticon | Always-on surveillance with consequences | Keystroke logging, screenshot capture, activity alerts to managers | Catastrophic: mass exodus |
Most companies that fail with metrics jump straight to "Risky" or "Toxic" without realizing it. The difference between healthy and toxic often isn't which metrics you track — it's how you use them.
Why Developers Fear Metrics (And Why They're Right)
Let's take the developer perspective seriously, because it's grounded in real experience:
Fear 1: "They'll reduce my work to a number"
Valid because: Software development is creative, complex work. A developer who spends a week designing an elegant solution that prevents months of technical debt has created enormous value — but their "coding hours" that week might be near zero.
How to address it: Never use a single metric in isolation. Always combine quantitative data with qualitative context. Make it explicit: "Activity Time tells us how much time you spent in the IDE, not how much value you created."
Fear 2: "They'll use it to justify firing me"
Valid because: It has happened. Companies have used monitoring tools to build cases for termination, circumventing proper performance management.
How to address it: Establish a clear written policy: metrics data cannot be the sole basis for any disciplinary action. Period. Put it in the employee handbook. Have HR enforce it.
Fear 3: "I'll be optimizing for the metric instead of doing my best work"
Valid because: Goodhart's Law is real — and well-documented in engineering contexts. Stripe's "Developer Coefficient" research showed that a significant share of developer time is already lost to working around bad code. Adding metric-driven pressure can make this worse. If you reward lines of code, you get bloated code. If you reward PR count, you get tiny, meaningless PRs.
How to address it: Never set individual targets for engineering metrics. Use metrics for observation and conversation, not for compensation or ranking.
Fear 4: "It'll be used to compare me unfairly"
Valid because: A staff engineer doing architecture work will have different Activity Time than a mid-level developer cranking out features. A developer on a legacy codebase will have longer PR cycle times than one on a greenfield project.
How to address it: Compare individuals only to their own historical trends. Compare teams only to teams with similar contexts. Make this a hard rule.
The Seven Principles of Non-Toxic Metrics
Real-world experience confirms that metrics can work without toxicity. Here's how one CTO describes the approach:
"As a CTO and for our tech leads, it's important to see not individual employees but the state of the development process: where it's efficient and where it breaks down. The product allows natively collecting metrics right from the IDE, without feeling controlled or surveilled. Implementation was very simple." — Maksim Popov, CTO ABR Tech (Forbes Kazakhstan, April 2026)
Principle 1: Transparency by Default
Every developer should be able to see exactly the same data about themselves that their manager sees. No hidden dashboards. No secret reports.
Implementation:
- Give developers access to their own metrics dashboards
- Show them the same views their managers use
- If a manager can see a developer's Activity Time, the developer can see it too
Why it works: Surveillance requires secrecy. When everything is visible, it's not surveillance — it's shared context. A developer who can see their own Focus Time trend is empowered to advocate for fewer meetings. A developer who discovers their manager is secretly tracking their keystrokes is looking for a new job.
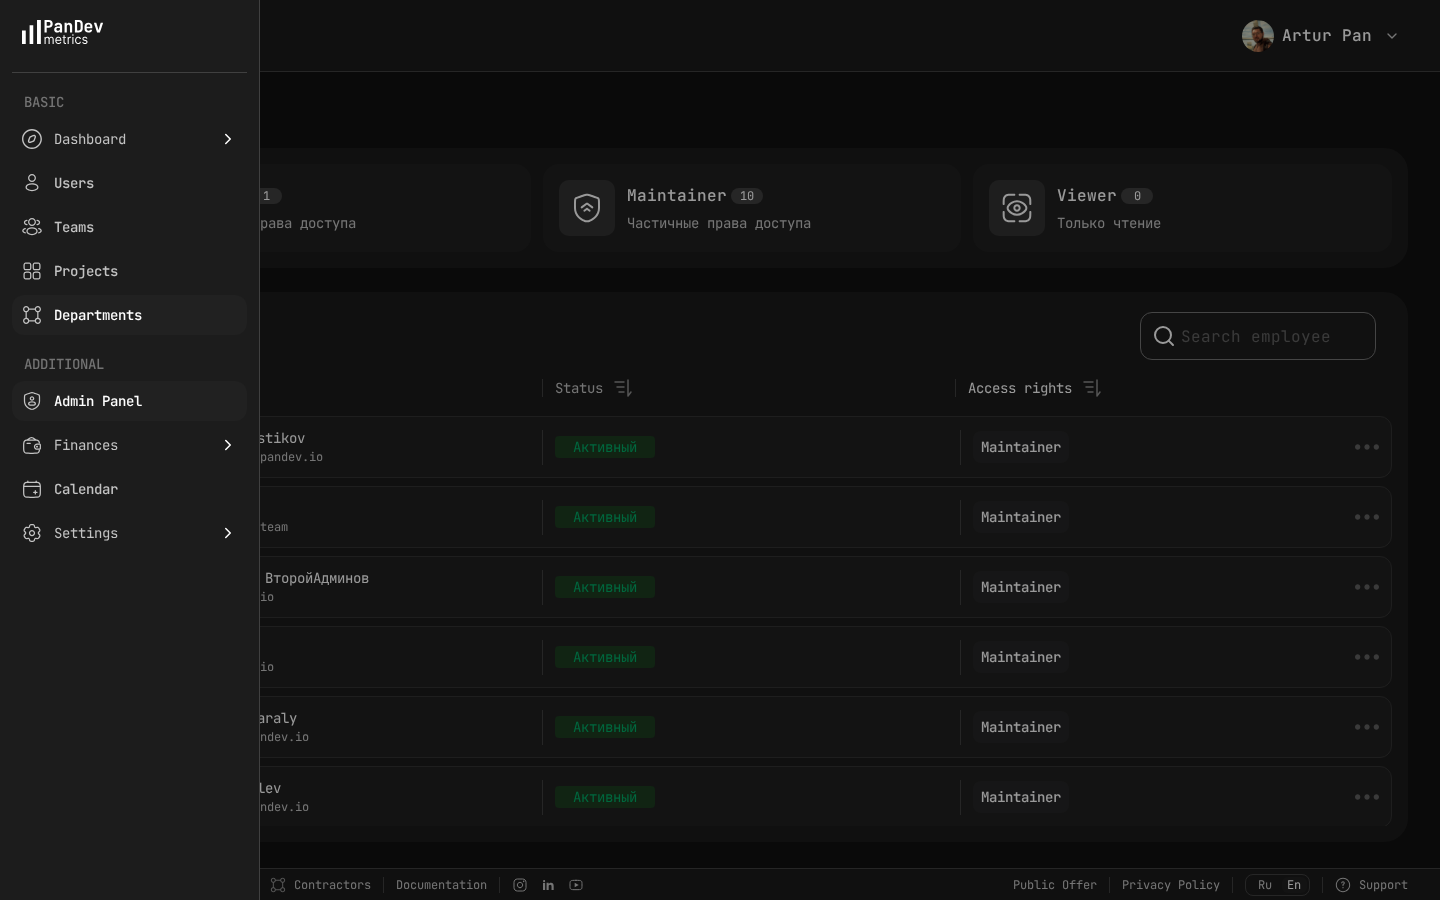 The admin panel lets you control who sees what — assigning Owner, Maintainer, or Viewer roles ensures metrics visibility is transparent and appropriately scoped.
Principle 2: Team Metrics Over Individual Metrics
Default to showing team-level aggregates. Individual data should be accessible but never the primary view for leadership.
Implementation:
- Executive dashboards show department and team metrics only
- Manager dashboards show team aggregates with ability to drill into individual data when investigating specific patterns
- Individual dashboards are primarily for the developer themselves
Why it works: Team-level metrics create collective ownership. "Our team's lead time is too long" is a problem everyone can work on. "Your lead time is too long" is an accusation.
Principle 3: Context Before Conclusions
Every metric anomaly has a story behind it. The data tells you what happened; only the person can tell you why.
Implementation:
- Never act on a metric without asking the person or team for context
- Build "annotation" capabilities — let teams mark events (deployments, incidents, offsites) that explain metric changes
- Train managers to lead with questions: "I noticed X — what's happening?" not "Your X is bad."
Why it works: A developer whose Activity Time dropped to zero for two days might have been doing design work, attending a conference, handling a family emergency, or debugging a production issue that required reading logs, not writing code. Jumping to conclusions is toxic. Asking is not.
Principle 4: Trends Over Snapshots
A single data point is noise. A trend is a signal. Never react to a single measurement.
Implementation:
- Show all metrics with at least 4-week trend lines
- Set alerts on sustained trends (3+ weeks), not individual data points
- When discussing metrics in 1:1s, always show the trend chart, never a single number
Why it works: Engineering work is inherently variable. Some weeks you write a lot of code; some weeks you review, plan, and design. Only sustained patterns indicate real issues or improvements.
Principle 5: Metrics Inform Conversations, Not Decisions
Data should generate questions, not answers. The answer always comes from the human conversation.
Implementation:
- No automated alerts to managers when individual metrics drop below thresholds
- No automated performance flags based on metrics
- Metrics feed into 1:1 agendas, not HR systems
Why it works: When metrics directly trigger consequences (alerts, warnings, performance actions), people optimize for the metric. When metrics trigger conversations, people engage honestly with the underlying issues.
Principle 6: Developers Own Their Data
Developers should be able to use their own metrics to advocate for better working conditions, demonstrate impact, and guide their own growth.
Implementation:
- Personal dashboards that only the developer and their direct manager can see
- Self-service data export so developers can use their metrics in self-reviews and promotion cases
- Developer-facing features: "Your Focus Time is highest on Wednesdays and lowest on Tuesdays. Here's your meeting schedule on Tuesdays."
Why it works: When metrics are a tool for developers rather than a tool about developers, adoption is natural. A developer who uses their own data to justify a schedule change is an empowered developer, not a surveilled one.
Principle 7: Measure What Matters, Not What's Easy
Lines of code, commit count, and hours logged are easy to measure but meaningless at best and harmful at worst. Measure outcomes and patterns that actually inform better decisions.
Implementation:
| Measure This | Not This |
|---|---|
| Focus Time (uninterrupted blocks) | Hours logged |
| Delivery Index (commitment vs. actual) | Story points completed |
| Lead Time (commit to production) | Number of deployments |
| Activity Time trends | Daily coding minutes |
| Team health patterns | Individual productivity scores |
The Rollout Playbook: How to Introduce Metrics Without Revolt
Phase 1: Leadership Alignment (Week 1-2)
Before showing anything to developers, align your leadership team:
- Define the purpose — Write it down: "We're implementing engineering metrics to identify systemic bottlenecks and improve working conditions, not to evaluate individual performance."
- Set usage policies — What data can be used in reviews? In promotions? In terminations? Get clear, get it in writing.
- Train managers — Every manager who will see individual data needs training on the seven principles above. This is not optional.
Phase 2: Developer Communication (Week 3)
Hold an all-hands or team meetings (not an email — this deserves face time):
- Explain the why — "We want to make better decisions about meetings, process, and tooling. We need data to do that."
- Show what you'll measure — No surprises. List every metric and explain what it means.
- Show what developers will see — Demo the developer dashboard. Show them their own data first.
- Explain what it won't be used for — "This will not be used for individual performance rankings. This policy is in writing."
- Take questions — Every single one. Honestly. If you don't have an answer, say so and commit to getting one.
Phase 3: Soft Launch (Week 4-6)
Roll out with guardrails:
- Developers get their own dashboards first (before managers)
- Managers see only team aggregates initially
- No metrics appear in any reviews or evaluations during this period
- Collect feedback actively — "Is anything about this making you uncomfortable?"
Phase 4: Full Launch (Week 7+)
Based on feedback from the soft launch:
- Enable manager access to individual metrics (with the developer's knowledge)
- Begin using team-level metrics in planning and retrospectives
- Start incorporating data into 1:1 conversations (collaboratively, not evaluatively)
- Monthly feedback check: "How are we doing with this?"
What to Do When Metrics Reveal Problems
The real test of non-toxic metrics comes when the data shows something concerning.
Scenario: A Developer's Activity Time Drops Significantly
Toxic response: Message the developer: "Your Activity Time dropped 60% this week. Please explain."
Non-toxic response: Note it. Check if it's a one-week anomaly. If it persists for 2-3 weeks, bring it up in a 1:1 with genuine curiosity: "I noticed you've had less coding time recently — is everything okay? Are you working on something that doesn't show up in IDE time, like design or research?"
Scenario: A Team's Delivery Index Is Consistently Low
Toxic response: Rank the team members and identify the "low performers" dragging the team down.
Non-toxic response: Look at the systemic factors. Is the team over-committed? Are requirements unclear? Is there technical debt slowing them down? Are they under-staffed? Discuss with the EM and the team together. The fix is almost always structural, not individual.
Scenario: One Developer's Metrics Are Great, but Peer Feedback Is Negative
Toxic response: Ignore the peer feedback because "the numbers look good."
Non-toxic response: Recognize that metrics capture only one dimension of performance. A developer who ships fast but writes unmaintainable code, doesn't review others' PRs, or creates a hostile environment is not a high performer, regardless of what the Activity Time says. Metrics are a complement to, not a replacement for, human judgment.
The Role of HR in Non-Toxic Metrics
HR should be a partner in this, not an afterthought:
HR Responsibilities
- Policy enforcement — Ensure metrics usage policies are followed. If a manager uses Activity Time as the sole basis for a negative review, HR should flag it.
- Training — Help develop and deliver manager training on ethical metrics usage.
- Feedback channel — Provide a safe channel for developers to report concerns about how metrics are being used.
- Review integration — Define how (and if) metrics appear in formal review processes.
- Legal compliance — Ensure metrics collection complies with local labor laws and data protection regulations (GDPR and others).
What HR Should NOT Do
- Use engineering metrics to build termination cases independently
- Create org-wide "productivity rankings"
- Set minimum thresholds for individual metrics
- Access individual developer data without a specific, documented reason
The Long Game: Metrics as a Cultural Asset
When done right, metrics become something developers actually want. Here's what mature, non-toxic metrics culture looks like:
- Developers proactively check their own dashboards and bring insights to 1:1s
- Teams use metrics in retrospectives to identify process improvements
- Managers use data to advocate for their teams — "My team needs fewer meetings; here's the Focus Time data to prove it"
- Hiring conversations include metrics context — "Here's the data showing we're at capacity"
- The word 'metrics' doesn't trigger anxiety in the engineering org
This doesn't happen overnight. It takes 3-6 months of consistent, principled usage. But once the trust is established, it's a genuine competitive advantage — because most engineering organizations are flying blind. The Accelerate research confirms this finding: teams that use metrics transparently and without punitive intent consistently rank among the highest performers in both delivery and culture.
A Checklist for Ethical Metrics Implementation
Use this checklist to audit your current (or planned) metrics program:
- Developers can see all data collected about them
- No individual metrics are used in compensation decisions
- Managers are trained on ethical data usage
- Written policy exists defining how metrics can and cannot be used
- Team-level data is the default view for leadership
- Individual data is used for 1:1 conversations, not rankings
- Trends are emphasized over snapshots
- Context is always sought before conclusions are drawn
- HR has reviewed and approved the metrics program
- Regular feedback is collected from developers about their experience
- The metrics program has a documented purpose statement
If you can't check all of these, you're not ready to implement engineering metrics. Fix the gaps first.
Measure engineering with trust, not surveillance. PanDev Metrics is built on the principle that developers should see their own data. With role-based access control (from Admin to Developer), personal dashboards, and team-level aggregates for leadership, PanDev gives you engineering intelligence without the panopticon. On-premise deployment available for organizations that need full data control.