Cost Attribution in Microservices: Who Pays for Auth?

A platform team of 6 engineers costs $156K per quarter. They run auth, observability, the internal API gateway, the shared cache, and the deploy pipeline. Eight product teams use those services every day. Ask the CFO who pays for it and the answer is "central R&D." Ask the platform lead who consumes it and the answer is "everyone equally." Both are wrong, and the gap between them is where engineering finance loses six figures a year in distorted decisions.
Adrian Cockcroft made the original argument when Netflix decoupled into microservices: shared infrastructure has a unit cost, and unit cost should follow the request. The CNCF FinOps Working Group in their 2024 State of FinOps for Engineering report found fewer than 24% of microservices organizations allocate platform-team time back to consumer teams. The other 76% treat platform engineering as overhead, which means the team consuming 41% of platform requests is invoiced the same as the team consuming 1%.
{/* truncate */}
The contrarian claim
Most engineering finance discussions stop at "platform team is overhead." That treatment is what makes platform teams chronically under-resourced and product teams chronically careless about what they ask for. Real chargeback says each consumer team pays for the platform-team time their requests actually drove. Shadow chargeback for six months, then make it real, and the budget conversation changes inside one fiscal year.
The hard part is not the philosophy. It is choosing among three models, each with different accuracy and operational cost. We have shipped all three at customer organizations. Here is what we learned.
Three chargeback models
Atlassian's State of DevOps 2024 found the average product team in a microservices architecture depends on 5.3 platform services and submits 17 platform-team tickets per quarter. That is the workload that needs allocating. The three options:
| Model | What it measures | Accuracy | Operational cost |
|---|---|---|---|
| Flat-tax | Total platform cost ÷ number of consumer teams | Low | None |
| Proportional | Platform-team Jira tickets attributable to each consumer team | High | Medium (issue-tagging discipline) |
| Consumption | API calls / requests / events sent by each consumer team | Highest | High (telemetry instrumentation) |
Flat-tax is what most CFOs default to when forced to allocate. It is wrong almost on purpose. Proportional and consumption both work, but they ask different things from the org.
Flat-tax: simple, frequently unfair
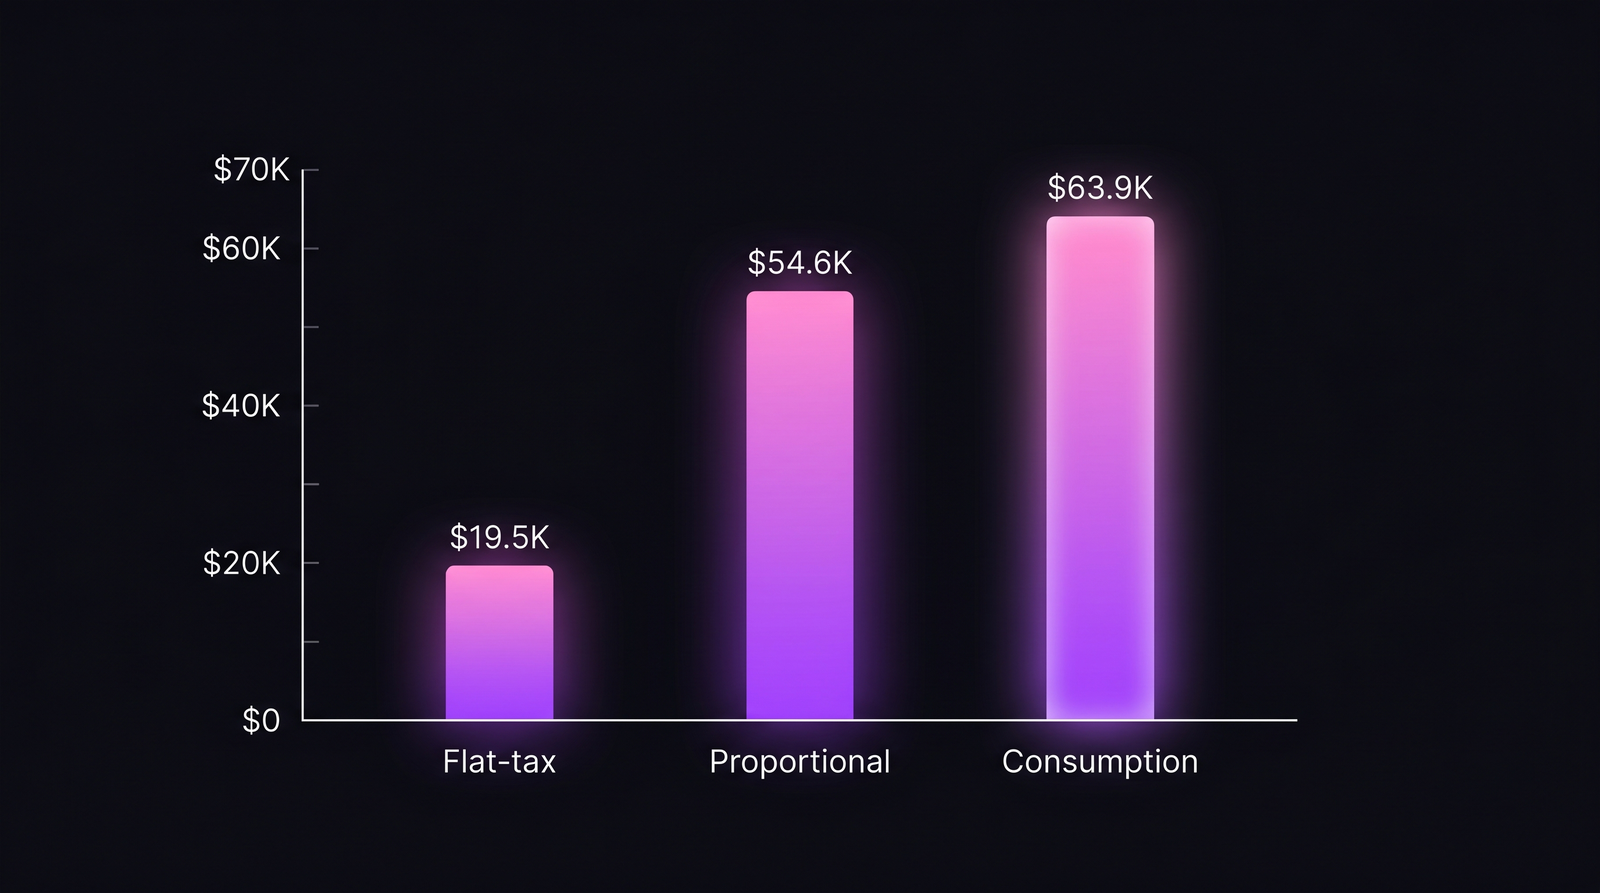
Take the quarterly platform cost ($156K), divide by 8 teams, send each team a $19.5K invoice. Done in five minutes.
The problem: Team A submitted 35% of platform tickets and made 41% of API calls. Team H submitted two tickets and made 1% of calls. Both pay $19.5K. Team H subsidises Team A by roughly $15K per quarter. Team A has zero incentive to optimise its platform usage because the cost is fixed regardless of behaviour.
Flat-tax is the right model for one situation only: when consumption variance across teams is genuinely small (every team uses platform similarly) and when chargeback exists for accounting hygiene rather than behavioural signal. That is rare in practice.
Proportional: by Jira ticket count
Count platform-team Jira tickets attributable to each consumer team over the period. Allocate cost in proportion. Team A drove 35% of tickets, Team A pays 35% of $156K = $54.6K.
This works because platform-team time is the binding constraint. Whether a request was a one-line config tweak or a two-week migration, the engineer-hour is the unit being consumed. Tickets approximate hours within ±20% if the team works in roughly-uniform-sized issues.
The operational cost is real. Every platform-team ticket needs a consumer_team field or a label. Without it, the model degrades to flat-tax in disguise. We covered the issue-level attribution mechanics in Cost per Jira Ticket: Trace Spend to a Single Issue. Proportional chargeback is the cross-team rollup of the same primitive.
Consumption: by API calls or requests
Instrument the platform service. Count requests per consumer team. Allocate cost in proportion to consumption. If the auth service handles 10M requests per quarter and Team A made 4.1M of them, Team A's share is 41% × $156K = $63.9K.
This is the most accurate model because it measures the thing the service actually does. It is also the most expensive to set up. You need consistent team-tagging at the API boundary (an X-Team-ID header, a service-mesh label, an OAuth client claim — pick one and enforce it). Without consistent tagging, you cannot tell whether 10K requests came from Team A's order service or Team H's recommendation service.
Consumption-based chargeback also surfaces problems flat-tax cannot: a team whose retry logic is broken and is hammering platform with 5× more requests than intended pays 5× more. They notice, fix the bug, and platform load drops. The signal is exactly what you want.
Worked example: $156K platform team across 8 product teams
A real platform team of 6 engineers, $52K monthly loaded cost, $156K per quarter. Eight product teams, named A through H by descending platform dependency. Three months of data. Here is what each team owes under each model.
| Team | Tickets | API share | Flat-tax | Proportional | Consumption |
|---|---|---|---|---|---|
| A | 35% | 41% | $19.5K | $54.6K | $63.9K |
| B | 22% | 19% | $19.5K | $34.3K | $29.6K |
| C | 18% | 14% | $19.5K | $28.1K | $21.8K |
| D | 9% | 11% | $19.5K | $14.0K | $17.2K |
| E | 7% | 7% | $19.5K | $10.9K | $10.9K |
| F | 5% | 4% | $19.5K | $7.8K | $6.2K |
| G | 3% | 3% | $19.5K | $4.7K | $4.7K |
| H | 1% | 1% | $19.5K | $1.6K | $1.6K |
| Total | 100% | 100% | $156K | $156K | $156K |
 Same quarter, same platform team, same Team A. The flat-tax bill is roughly a third of what consumption-based chargeback would actually invoice.
Three observations the table forces.
Team A is heavily platform-dependent. Under proportional, they pay $54.6K. Under consumption, $63.9K. Their consumption share (41%) outruns their ticket share (35%), which usually means they have automated their platform usage: fewer tickets per unit of value extracted. Under flat-tax, they pay $19.5K and look like everyone else. The platform lead has no idea Team A is the heaviest customer.
Team H is paying 12× their consumption share. Under flat-tax they pay $19.5K for 1% of value. That is a $17.9K transfer from Team H to the average. If Team H is a small product line trying to prove unit economics, they will conclude their cost base is broken. The cost is not broken. The allocation is.
Proportional and consumption don't always agree. Team B drove 22% of tickets but only 19% of API calls. Their tickets are heavier than average: fewer requests, more bespoke work. Proportional invoices them more ($34.3K vs $29.6K). Both numbers are defensible. Pick the model that matches what you want consumer teams to optimise: if you want them to ask less of platform, use proportional; if you want them to call less, use consumption.
How PanDev Metrics implements proportional and consumption
Most teams stall on proportional chargeback because their Jira hygiene is uneven. PanDev computes per-ticket cost using mv_activity_total_user_issue_daily, the materialised view that aggregates IDE heartbeat seconds per user per Jira issue per day. Roll that up by the consumer-team field on each ticket and you have proportional cost without the manual rate-card math.
The cross-team allocation works through gitProject membership in user_departments. When a platform engineer commits to a repository owned by Team A's department, the time is attributed to Team A's chargeback bucket automatically. The Teams Widget on /dashboard/finances surfaces this as a radar chart: one quick view of which consumer team drove how much platform-team work in the period.
For consumption-based chargeback, you still need to instrument the platform service yourself (PanDev does not collect API-gateway telemetry). What PanDev does provide is the cost-per-engineer-hour math that turns consumption shares into actual dollar figures, so the conversion from "Team A made 41% of requests" to "Team A owes $63.9K" is consistent across all consumer teams using the same loaded rate. We unpacked the underlying budget math in Bottom-up Engineering Budget: From Rate to Annual P&L.
When chargeback works (and when it is theatre)
Chargeback only works if the consumer team has budget authority over what they spend. If platform is funded centrally and product teams cannot decline, the invoice is a reporting exercise: interesting, but not a decision tool. The product team reads the number, has no lever, and the platform team cannot translate the data into headcount change either.
The fix is shadow chargeback. Run the model for six months. Send teams their phantom bills. Watch what happens. Most consumer teams adjust voluntarily before the chargeback ever becomes real, because they do not want to look like the team driving 41% of platform cost when their VP sees the dashboard. The behavioural signal works even when the financial transfer doesn't.
Make it real after the org has accepted the numbers as fair. Real chargeback means consumer teams have a platform budget line in their P&L and can choose to spend more (request more platform work) or less (build alternatives in-house). That is the conversation engineering finance is supposed to enable.
What the data won't tell you
The chargeback number says who paid. It does not say whether the platform team is sized correctly. A heavy consumer (Team A) might be a sign that platform is doing exactly what it should — leverage. Or it might be a sign that platform built the wrong abstraction and Team A is forced into expensive workarounds. Same number, opposite diagnoses.
Our IDE telemetry shows engineering time. It does not show whether that time produced the right outcomes. We are honest about the limit: chargeback surfaces cost, not value. Pair the chargeback view with consumer-team satisfaction and platform incident-rate trend before drawing conclusions about platform health.
The other limit: shared services that are genuinely public goods (security review, SOC2 evidence collection, compliance) probably should be flat-taxed. Allocating a security review by ticket count creates a perverse incentive to skip the review. Some platform output is non-discretionary, and chargeback is the wrong tool for it. Identify which platform services are discretionary versus mandatory before deciding model per service.
What to ship next quarter
Shadow run proportional first. It is the cheapest model to start because Jira data already exists; the only work is adding a consumer_team label to platform tickets. Three months of phantom bills will tell you whether consumption variance is real (it usually is) and whether the heaviest consumers are the ones you'd expect (often not). When the numbers stop surprising people, switch on the financial transfer and watch behaviour change. The Atlassian research suggests platform-team ticket volume drops 12-18% in the first two quarters after real chargeback goes live — not because demand vanished, but because consumers prioritised what they actually needed.
That drop is the entire reason this exercise is worth doing. The platform team's cost did not change. Their leverage did.