Motivating Developers Without the Stick: Positive Reinforcement Through Data

The most common fear engineers have about activity tracking is simple: "My manager will use this data against me."
They're not wrong to worry. Many organizations have implemented "productivity metrics" as a stick — identifying who codes the least, who commits the fewest lines, who logs the shortest hours. The result is predictable: developers game the metrics, resentment builds, top performers leave, and the remaining team optimizes for looking busy rather than being effective.
There's a better way. Data can be a tool for positive reinforcement — and it's far more effective.
{/* truncate */}
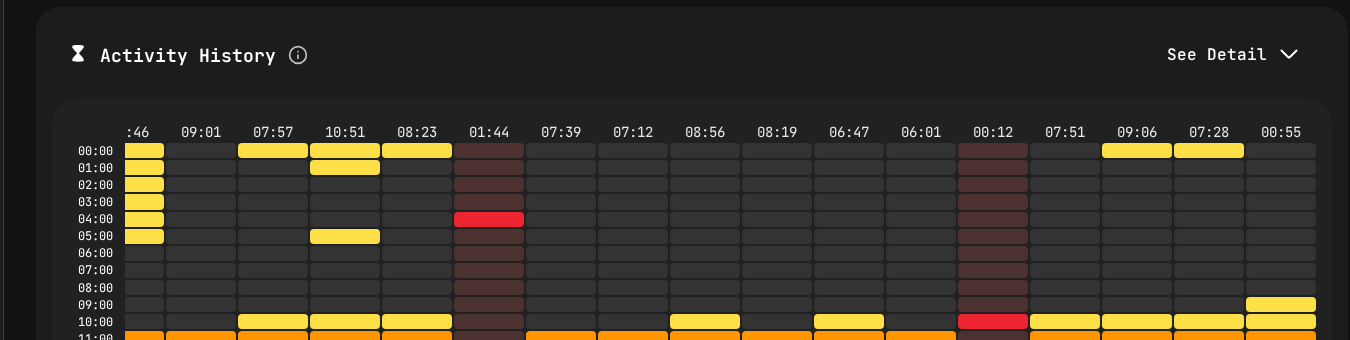
Activity patterns that reveal engagement, not just output.
The Problem with the Stick
Let's be direct about what punitive metrics look like in practice:
- Stack ranking by lines of code: Rewarding volume over quality
- Public shaming of "low performers": Based on hours logged or commits made
- Mandatory minimum coding hours: Treating knowledge work like factory shifts
- Using activity data in performance reviews: Without context or nuance
These approaches fail for predictable reasons:
Developers Are Not Factory Workers
Software development is creative knowledge work. Output isn't proportional to input time. A developer who solves a critical architecture problem in 2 hours of deep thinking delivers more value than one who writes 8 hours of boilerplate.
When you measure and punish based on visible activity, you incentivize visible activity — not value creation.
Goodhart's Law Strikes Again
Once developers know they're being measured on commits, they make more (smaller) commits. Measured on lines of code? More verbose code. Measured on hours in the IDE? They leave editors open while doing other things.
Every punitive metric creates its own workaround. The metric goes up. Actual productivity stays flat or declines.
Trust Destruction Is Expensive
Trust is the most valuable and fragile resource in an engineering team. Once developers believe their data is being used against them, they:
- Stop sharing honest status updates
- Avoid asking for help (it might make them look slow)
- Resist adopting new tools (they might reduce their visible output during the learning curve)
- Start job searching (the market for good developers is always hot)
Replacing a developer costs 50-200% of their annual salary. Destroying trust to gain a marginal (illusory) productivity improvement is terrible ROI.
The Alternative: Data as Positive Reinforcement
The same activity data that can be weaponized can also be used to celebrate, support, and develop your team. Here's how.
Principle 1: Celebrate Wins, Don't Hunt Failures
Instead of identifying who coded the least this week, identify who had a great week:
- "Alex, your coding sessions this sprint were incredibly focused — your longest session was 3.5 hours of uninterrupted work. That's impressive."
- "The frontend team hit a new weekly record for total coding hours. Great momentum on the dashboard feature."
- "Maria earned the Polyglot achievement — she's contributed to TypeScript, Python, and Go this month."
Positive recognition is more motivating than negative criticism. This isn't soft management — it's backed by decades of behavioral psychology research. Reinforced behaviors repeat. Punished behaviors hide.
Principle 2: Use Data for Self-Reflection, Not Surveillance
The most powerful use of activity data is giving developers visibility into their own patterns. Most developers don't have an accurate picture of how they spend their time.
When a developer sees their own data:
- "I thought I coded 4 hours a day, but it's actually 1.5 hours. Where does the rest of my time go?"
- "I'm most productive on Tuesday and Wednesday. Maybe I should schedule my hardest work then."
- "I haven't touched the backend in 3 weeks. I should probably re-engage with that module."
These insights drive self-improvement without any management pressure. The developer owns the discovery and the response.
PanDev Metrics is designed around this principle. Developers see their own dashboards. They control what's visible to others. The data serves the individual first, the manager second.
Principle 3: Coach, Don't Police
When data shows a potential issue — like a developer's coding hours dropping significantly — the correct response is curiosity, not punishment:
Punitive approach: "Your coding hours are down 40% this month. What's going on?"
Coaching approach: "I noticed your activity patterns have shifted recently. Are there blockers I can help with? Meeting overload? Unclear requirements? Something outside work?"
The coaching approach treats the data as a signal to start a supportive conversation, not as evidence for a disciplinary one. Nine times out of ten, declining activity has a fixable cause: too many meetings, unclear priorities, a personal issue, or a particularly difficult technical problem.
Principle 4: Aggregate, Don't Individualize (for Management Purposes)
Engineering managers should primarily look at team-level data:
- Total team coding hours (is the team consistently productive?)
- Weekly patterns (is Tuesday still the peak? Is Friday reasonable?)
- Language and project distribution (is work balanced across the codebase?)
Individual data should be for the individual. Team data should be for the manager. When a manager needs to look at an individual's data, it should be with the developer present, in the context of a supportive 1:1.
Principle 5: Recognize Consistency, Not Just Peaks
Some developers have explosive productive days followed by low-activity recovery days. Others maintain steady, consistent output. Both patterns can be effective, but consistency is often undervalued.
Use data to recognize consistent contributors:
- "You've been active every workday for the past month — that's a solid streak."
- "Your coding hours have been remarkably stable. That kind of consistency is the backbone of reliable delivery."
Consistency badges and streak achievements (like those in PanDev Metrics) provide this recognition automatically.
Practical Playbook for Engineering Managers
Weekly Team Wins
Start your weekly team sync with data-driven wins:
- Open the team dashboard in PanDev Metrics
- Highlight total team coding hours and compare to the previous week
- Call out individual achievements (new badges, level-ups, streak milestones)
- Celebrate the team's most productive day
- Acknowledge challenges without blame ("Friday was lighter than usual — let's make sure the sprint scope is realistic")
This takes 3 minutes and sets a positive tone for the entire meeting.
Monthly 1:1 Data Review
In your monthly 1:1 with each developer:
- Share their activity dashboard (they've already seen it — this is a joint review)
- Ask what patterns they notice
- Discuss what's working and what's not
- Identify environmental improvements you can make (fewer meetings, clearer requirements, better tooling)
- Set voluntary goals based on the developer's own observations
Never: Use the data to criticize, compare with other individuals, or set mandatory activity targets.
Quarterly Team Retrospective
Every quarter, review team-level trends:
- Is total team activity increasing, stable, or declining?
- Are weekly patterns healthy (peak mid-week, reasonable Friday, minimal weekend)?
- Are there language or project distribution imbalances?
- What achievements and milestones did the team hit?
Use this as input for process improvements, not performance evaluations.
What About Genuinely Low Performers?
The inevitable question: "What if someone really isn't performing? Don't I need data to address it?"
Yes — but not activity data alone. Genuine performance issues are visible through multiple signals:
- Delivery: Are committed tasks being completed on time?
- Quality: Are code reviews flagging consistent issues?
- Collaboration: Are teammates reporting communication problems?
- Growth: Is the developer improving over time, or stagnating?
Activity data might confirm a pattern you've already identified through these signals. But it should never be the starting point for a performance conversation. Start with outcomes, not inputs.
And when you do address performance issues, the conversation should still be coaching-oriented:
"I've noticed deliverables have been delayed recently, and I want to help. Let's look at the data together and figure out what's blocking you."
This preserves dignity, identifies root causes, and often resolves the issue without adversarial dynamics.
The ROI of Positive Reinforcement
Is the "soft" approach actually more effective? The evidence says yes:
- Gallup research consistently shows that recognized employees are ~20% more productive, more engaged, and less likely to leave
- Google's Project Oxygen found that the most effective managers are good coaches, not disciplinarians — this aligns with Cal Newport's Deep Work argument that protecting focus time is a manager's highest-leverage action
- Microsoft's shift away from stack ranking in 2013 was followed by a cultural and business renaissance — not a coincidence
- The Stack Overflow Developer Survey data on job satisfaction consistently ranks "feeling of accomplishment" and "peer recognition" above compensation as drivers of retention
In engineering specifically, positive environments attract and retain better talent. In a market where top developers have multiple offers, the company that makes them feel valued wins.
Building a Culture, Not Just a System
Tools like PanDev Metrics provide the data infrastructure. But the culture is up to you.
The tool doesn't determine the outcome. The culture does.
In a high-trust culture, activity data is fuel for celebration, coaching, and self-improvement. In a low-trust culture, the same data becomes a weapon. The tool is neutral. The leader's intent makes the difference.
If you're an engineering manager considering activity tracking for your team, start by asking yourself: "Am I implementing this to help my team or to control them?" If the answer is "control," fix your management approach first. The tool won't save you.
If the answer is "help" — then you have an opportunity to build something genuinely valuable: a data-informed culture where developers feel seen, supported, and motivated to do their best work.
Conclusion
The stick doesn't work with developers. Punitive metrics destroy trust, incentivize gaming, and drive top talent away. The alternative — using data for positive reinforcement, self-reflection, and coaching — is both more humane and more effective.
Activity data is powerful. Use that power wisely: celebrate wins, coach through challenges, and trust your team to be motivated by recognition rather than fear.
Data for motivation, not surveillance. PanDev Metrics gives developers their own activity dashboards and gives managers team-level insights — designed for positive reinforcement, not policing.