MTTR Explained: Mean Time to Recovery as a DORA Metric

Two production outages, same root cause: a bad config push that crashed a payments service. Team A spent 2 hours 14 minutes restoring service. Team B was back in 6 minutes. Team B's MTTR wasn't lower because they had smarter engineers. They had a one-command rollback rehearsed monthly, a runbook pinned in the on-call channel, and write access to production already granted to the responder. That 134-minute gap is what MTTR measures, and what separates the DORA 2023 State of DevOps Report elite cluster from everyone else.
{/* truncate */}
MTTR is one number that answers a hard question
MTTR (Mean Time to Recovery) is the average time it takes a team to restore service after a production-impacting failure. In DORA's framing it's also called Time to Restore Service, and it sits alongside Deployment Frequency, Lead Time for Changes, and Change Failure Rate as one of the four delivery metrics.
The hard question MTTR answers: when (not if) production breaks, how fast does the team get users back to normal? Not how fast they find the root cause. Not how fast they ship the permanent fix. A rollback that restores service in 4 minutes counts as a 4-minute MTTR even if root-cause analysis runs for two days afterward. Google's Site Reliability Engineering book makes this distinction explicitly: the incident-response goal is restoring service, with root-cause investigation as a separate workstream that runs in parallel or after.
The MTTR formula
MTTR = sum(recovery_duration_per_incident) / number_of_incidents
Recovery duration is measured per incident as:
recovery_duration = service_restored_timestamp − incident_start_timestamp
Concrete example, March 2026, one team:
| Incident | Started | Restored | Duration |
|---|---|---|---|
| INC-412 | 03:14 | 03:21 | 7 min |
| INC-418 | 11:02 | 11:45 | 43 min |
| INC-421 | 16:30 | 16:36 | 6 min |
| INC-427 | 22:11 | 23:54 | 1h 43m |
MTTR for the month = (7 + 43 + 6 + 103) / 4 = 39.75 minutes.
A nuance most teams skip: mean is sensitive to outliers. One 14-hour incident can mask ten 5-minute recoveries. Many SRE teams track p50 (median) and p95 alongside the arithmetic mean. A 12-minute median with a 4-hour p95 tells a very different operational story than the same mean.
MTTR benchmarks 2026 (DORA)
The 2023 DORA report split teams into four performance tiers. The 2024 update narrowed the elite-vs-rest gap on some metrics but kept MTTR thresholds essentially intact:
| Performance level | MTTR | Typical org pattern |
|---|---|---|
| Elite | Less than 1 hour | Rollback automated, runbooks rehearsed, on-call has prod write access |
| High | Less than 1 day | Documented rollback, on-call paged within 5 min, blameless postmortems |
| Medium | 1 day to 1 week | Manual rollback, root-cause-first culture, approvals required |
| Low | More than 1 week | No runbooks, root-cause-only fixes, on-call without authority |
The category boundaries are intentionally wide because cross-industry comparison breaks at finer resolution. A fintech with regulator-mandated change windows behaves nothing like a consumer SaaS, but both can be "elite" by DORA's definition.
What counts as an incident
This is the part most MTTR conversations skip, and it's the part that makes the number trustworthy or noise. An incident, for MTTR purposes, is a production-impacting failure detected by alerting or customer report. Two criteria, both required:
- Production impact. Users (internal or external) experience degraded service. A failed staging deploy is not an incident.
- Detection. There's a timestamp for "we noticed" or "the alert fired". A bug discovered six months later by a customer email doesn't enter the MTTR calculation; that's a defect, not an incident.
Most mature teams use severity tiers and only include SEV-1 and SEV-2 in the headline MTTR:
| Severity | Definition | Included in DORA MTTR? |
|---|---|---|
| SEV-1 | Full outage, major revenue/safety impact | Yes |
| SEV-2 | Significant degradation, partial outage | Yes |
| SEV-3 | Minor degradation, workaround exists | Optional, often tracked separately |
| SEV-4 | Cosmetic / non-user-facing | No |
Mixing SEV-3 noise into the same number that should drive incident-response investment is one of the more common reporting mistakes I've watched teams correct in their second quarter of DORA tracking.
How to drive MTTR down
The contrarian claim in this guide: a 5-minute MTTR is almost always achieved by boring infrastructure (fast rollback, rehearsed runbooks, clear authority), not by sophisticated AI-driven root-cause analysis. The fancy tools help when you need to understand why the system broke. They rarely help when you need to make it stop breaking right now.
The five investments that move MTTR more than any tooling purchase:
- One-command rollback to last green deploy. If the rollback path requires Slack approvals or a code freeze, your MTTR floor is approval latency.
- Runbooks for the top 5 failure modes. Not an encyclopedia. The five most likely incidents based on the last 12 months. Pinned in the on-call channel. Rehearsed quarterly.
- On-call authority pre-granted. The responder has production write access before the incident, not after a permissions dance at 3 AM.
- Blameless postmortems with a runbook update field. Every postmortem ends with at least one runbook delta. No delta means the team didn't learn.
- Observability for the boring questions. "Did anything deploy in the last 30 minutes? Did traffic to this endpoint spike? Did the database hit a connection limit?" These three answers solve 60-70% of incidents in our experience.
Notice what's not on this list: ML-based anomaly detection, AIOps platforms, automated root-cause analysis. They're useful at scale but they're not the lever that moves a team from 4-hour MTTR to 40-minute MTTR. Rollback automation is.
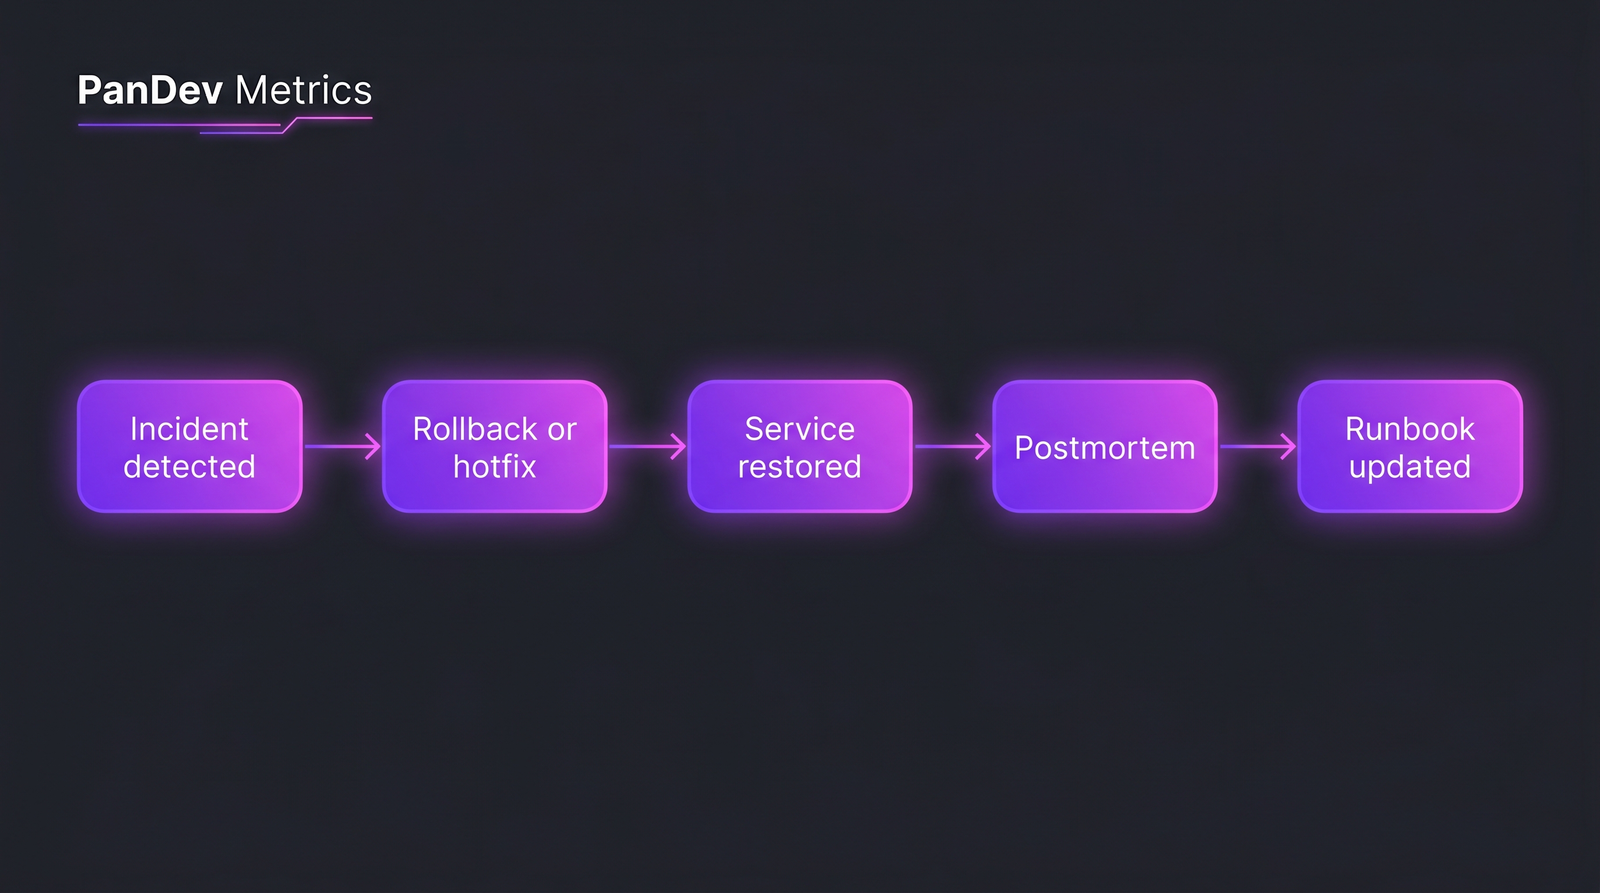 The five stages of a fast recovery. Most teams optimize stage 4 (postmortem) and ignore stage 2 (rollback).
MTTR vs MTBF vs MTTD — adjacent metrics
These three get conflated constantly. They measure different things:
| Metric | Stands for | What it measures |
|---|---|---|
| MTTR | Mean Time to Recovery | Detection → service restored |
| MTBF | Mean Time Between Failures | Time between two consecutive incidents |
| MTTD | Mean Time to Detect | Incident started → team noticed |
MTBF is the prevention metric. MTTD is the alerting metric. MTTR is the response metric. Together with Change Failure Rate, they describe a complete incident lifecycle. A team with great MTBF (rare incidents) and bad MTTR (each one drags on) is fragile in a way the headline reliability number hides.
The honest limit admission: MTTR alone measures recovery, not prevention. A team can hit elite MTTR while shipping 20% Change Failure Rate — they just got very good at cleaning up their own mess. That's why DORA tracks the four metrics as a system. If you only watch MTTR, you'll optimize for fast cleanup and miss that you're causing too many incidents in the first place.
How PanDev Metrics calculates this
If your incidents live in Jira (or PagerDuty, or ClickUp), PanDev Metrics pulls them in through the task-tracker integration and computes MTTR per team, per service, per severity automatically. The module reconciles incident_start and service_restored timestamps against deployment events from your CI/CD integration, so an incident resolved by a rollback shows up with the rollback deploy linked. The same pipeline drives Change Failure Rate and Deployment Frequency, so the four DORA metrics sit on one screen instead of four separate exports.
That's the practical answer to "how do I track MTTR without building a pipeline". It lives next to the rest of the DORA set in the delivery dashboard.
FAQ
What does MTTR stand for? Mean Time to Recovery (sometimes Mean Time to Restore Service in the DORA framing). It's the average duration from incident detection to service restoration.
What's a normal MTTR? Per DORA 2023: under 1 hour is elite, under 1 day is high-performing, 1 day to 1 week is medium, over a week is low. Most teams I've seen land in the medium tier in their first year of tracking and move to high after focused rollback investment.
Is MTTR part of DORA? Yes. MTTR (or "Time to Restore Service") is one of the four DORA metrics: Deployment Frequency, Lead Time for Changes, Change Failure Rate, and MTTR. The four are designed to be tracked together. Improving one in isolation usually distorts another.
How do I calculate MTTR?
MTTR = sum(recovery_duration_per_incident) / number_of_incidents. Recovery duration is the wall-clock time from when the incident was detected (alert fired or customer reported) to when service was fully restored, regardless of whether the root cause was found. Most teams also track p50 and p95 separately because the mean is outlier-sensitive.
How does MTTR relate to SLAs? SLAs typically promise availability over a period ("99.9% uptime per month"). MTTR is one of the inputs. If your MTTR is high, your downtime burns through the error budget faster. A team with 99.9% monthly availability has only about 43 minutes of permissible downtime per month, which is one elite-tier recovery from one severe incident. Track them together: MTTR is the operational metric, SLA is the contractual one.