MTTR Targets 2026: Realistic DORA Speed of Recovery Benchmarks for Your Team

Google's Site Reliability Engineering book (2016) popularized a counterintuitive principle: accept failure as inevitable and invest in recovery speed. The DORA research confirmed it with data — the difference between elite and low-performing teams isn't that elite teams have fewer incidents. It's that they recover in under an hour instead of under a week. Every engineering organization invests in preventing failures. Fewer invest in recovering from them quickly. The data says this is backwards.
{/* truncate */}
What MTTR Actually Measures
MTTR in the DORA context stands for Mean Time to Restore Service — the average time from when a production failure is detected to when service is fully restored for users.
Key distinction: this is not Mean Time to Repair (fix the root cause). It's Mean Time to Restore (get users back to normal). You can restore service by rolling back while the root cause investigation continues. The DORA metric cares about user impact duration, not engineering investigation duration.
The 2023 State of DevOps Report benchmarks:
| Performance Level | MTTR |
|---|---|
| Elite | Less than 1 hour |
| High | Less than 1 day |
| Medium | Between 1 day and 1 week |
| Low | More than 1 week |
The gap is enormous. An elite team restores service in under 60 minutes. A low performer can take over a week. For a customer-facing service, the difference between 45 minutes and 5 days of degradation is not incremental — it's existential.
The Prevention Trap
Most engineering organizations invest heavily in prevention:
- More tests
- More code review
- More approval gates
- More staging environments
- Longer QA cycles
These investments have diminishing returns. You can't test for every production scenario. You can't review away every bug. You can't gate-keep your way to zero incidents.
Meanwhile, the same organizations treat incident response as an afterthought:
- No documented runbooks
- Rollback requires 3 approvals and a deployment window
- Incident communication happens ad-hoc in a Slack thread
- Post-mortems happen "when we have time" (never)
- Nobody has practiced recovering from the most likely failure modes
This is like a hospital that invests everything in preventive medicine and nothing in the emergency room. Prevention is important, but when something goes wrong — and it will — you need the ER to be world-class.
The Math of Recovery vs. Prevention
Consider two teams:
Team A: Prevention-focused
- Deploys biweekly (lots of QA)
- Change Failure Rate: 5% (very low)
- MTTR: 8 hours (slow recovery)
- Deployments per month: ~2
- Expected incidents per month: 0.1
- Expected downtime per month: 0.1 × 8 hours = 0.8 hours
Team B: Recovery-focused
- Deploys daily
- Change Failure Rate: 12% (moderate)
- MTTR: 30 minutes (fast recovery)
- Deployments per month: ~22
- Expected incidents per month: 2.6
- Expected downtime per month: 2.6 × 0.5 hours = 1.3 hours
Team B has more incidents and more total downtime. But Team B also ships 11x more frequently, has a 4x shorter Lead Time, gets faster feedback, and delivers features weeks sooner. The additional 30 minutes of monthly downtime is a trivial cost for a massive delivery advantage.
Now improve Team B's MTTR to 15 minutes:
- Expected downtime: 2.6 × 0.25 = 0.65 hours — less than Team A.
Fast recovery + frequent deployment beats slow deployment + infrequent failure. This is the core DORA insight, articulated in Accelerate (Forsgren, Humble, Kim, 2018) and reinforced by the Google SRE framework's concept of error budgets.
The Anatomy of MTTR
MTTR consists of four phases. To improve MTTR, you need to compress each one:
Phase 1: Detection Time
What it is: Time from when the failure occurs to when someone knows about it.
Elite target: Under 5 minutes.
What slows it down:
- No automated alerting — incidents are discovered by customers or by someone manually checking dashboards
- Alert fatigue — so many alerts fire that teams ignore them
- Monitoring gaps — the affected component doesn't have health checks
- Threshold-based alerts that don't account for normal variation
How to compress it:
- Deploy anomaly detection on key metrics (error rate, latency p95, throughput)
- Correlate alerts with deployment events — "error rate spiked 2 minutes after deploy X" is immediately actionable
- Reduce alert noise: consolidate related alerts, set meaningful thresholds, delete alerts that never result in action
- Implement synthetic monitoring (uptime checks every 30 seconds from multiple regions)
Phase 2: Triage Time
What it is: Time from detection to understanding the scope and severity of the incident.
Elite target: Under 10 minutes.
What slows it down:
- Unclear ownership — "whose service is this?"
- No standardized severity definitions — people argue about whether it's a P1 or P2
- Incident response requires assembling a team manually
- No deployment tracking — "did anyone deploy something recently?"
How to compress it:
- Maintain a service ownership map (every service has a team, every team has an on-call)
- Define severity levels with objective criteria (e.g., P1: >1% of users affected, revenue impact >$X/hour)
- Automate incident channel creation with pre-populated context (recent deploys, current metrics, on-call roster)
- Display recent deployments prominently in incident dashboards
Phase 3: Remediation Time
What it is: Time from understanding the problem to executing a fix (rollback, hotfix, config change, infrastructure scaling).
Elite target: Under 15 minutes.
What slows it down:
- Rollback requires approval from someone who's asleep or in a meeting
- No rollback automation — someone has to manually check out an old commit, build, test, and deploy
- The system doesn't support rollback (database migrations are irreversible, API contracts are broken)
- Hotfix process requires a full code review cycle
How to compress it:
- One-click rollback: Any on-call engineer can trigger a rollback without approval. Trust your people.
- Automated rollback: If error rate exceeds X% within Y minutes of deploy, roll back automatically
- Forward-compatible changes: Database migrations should be backward-compatible. Old code should work with new schema and vice versa.
- Hotfix fast path: A documented, expedited process for emergency changes (abbreviated review, immediate deploy)
Phase 4: Verification Time
What it is: Time from executing the fix to confirming that service is restored.
Elite target: Under 10 minutes.
What slows it down:
- No automated health checks post-rollback
- Manual verification requires someone to test multiple user flows
- Monitoring lag — metrics take 10+ minutes to reflect reality
- Unclear definition of "restored" — does latency need to return to baseline or just below the alert threshold?
How to compress it:
- Automated post-rollback smoke tests
- Real-time monitoring with sub-minute granularity
- Define "service restored" criteria in advance (error rate below 0.1%, latency p95 below 200ms, key user flows succeeding)
- Synthetic transactions that verify end-to-end functionality
MTTR Benchmark Data Across Industries
Based on the State of DevOps research and industry surveys (including CNCF Annual Surveys for cloud-native organizations), here are typical MTTR ranges:
| Industry | Median MTTR | Elite MTTR | Primary Recovery Challenge |
|---|---|---|---|
| SaaS / Cloud-native | 1–4 hours | 15–30 min | Service dependency chains |
| Fintech | 2–8 hours | 30–60 min | Regulatory notification requirements |
| E-commerce | 30 min–4 hours | 10–30 min | Revenue pressure drives investment |
| Enterprise B2B | 4–24 hours | 1–4 hours | Complex on-premise deployments |
| Mobile apps | 24–72 hours | 4–24 hours | App store review for hotfixes |
| Government / Public sector | Days to weeks | 4–24 hours | Change control processes |
Mobile apps are a notable outlier: you can't roll back a mobile release. This makes prevention more important for mobile — and makes server-side feature flags critical for controlling behavior without app updates.
Building an MTTR Improvement Program
Step 1: Measure Accurately (Week 1)
Most teams don't measure MTTR at all, or measure it incorrectly. Start with:
- Define "incident" for your team. Recommendation: any event that causes user-visible degradation or requires unplanned remediation work.
- Record four timestamps for every incident: Detection time, Triage complete, Remediation executed, Service verified restored.
- Calculate MTTR as the duration from Detection to Verification.
- Baseline your current MTTR using the last 90 days of incidents. If you don't have clean data, start tracking now.
Step 2: Fix Detection (Week 2–3)
Detection is often the longest phase and the easiest to fix.
- Audit your monitoring: does every production service have error rate, latency, and availability metrics?
- Audit your alerting: are alerts actionable? Review the last 30 alerts — how many required human action? Delete the rest.
- Implement deployment-correlated alerting: when a deploy happens, tighten alert thresholds for 30 minutes.
- Add synthetic monitoring for critical user journeys.
Expected improvement: Detection time drops from 15–30 minutes to under 5 minutes.
Step 3: Fix Remediation (Week 3–4)
The highest-impact investment.
- Build one-click rollback. If your system doesn't support rollback, this is your top priority.
- Write runbooks for the top 5 incident types. Look at your last 20 incidents, categorize them, and write step-by-step remediation guides for the most common categories.
- Run a "game day." Simulate a production incident during business hours. Practice the entire response: detection, triage, remediation, verification. Time each phase. Identify bottlenecks.
- Eliminate approval gates for rollback. If rollback requires a manager's approval, remove that requirement. The on-call engineer should be empowered to act.
Expected improvement: Remediation time drops from hours to under 15 minutes for rollback-eligible incidents.
Step 4: Build the Feedback Loop (Ongoing)
- Blameless post-mortems for every P1 and P2 incident, within 48 hours.
- Track MTTR trend weekly. Display it on a team dashboard.
- Categorize incidents by root cause type. If 40% of incidents are caused by deployment config errors, invest in config validation.
- Run game days quarterly. Practice builds confidence and reveals decay in processes.
MTTR vs. MTTF: The Philosophical Shift
Traditional reliability engineering focuses on Mean Time to Failure (MTTF) — how long the system runs between failures. The goal is to maximize uptime by preventing failures.
Modern reliability engineering (SRE, DORA) focuses on MTTR — how quickly you recover when (not if) failures occur. The goal is to minimize the impact of inevitable failures.
This represents a philosophical shift:
| Aspect | MTTF / Prevention | MTTR / Recovery |
|---|---|---|
| Assumption | Failures are preventable | Failures are inevitable |
| Strategy | Invest in quality gates | Invest in recovery speed |
| Risk model | Avoid risk | Manage risk |
| Deploy approach | Deploy rarely, test exhaustively | Deploy frequently, recover quickly |
| Culture | Failure is bad | Failure is expected and manageable |
| Scale behavior | Gets harder as system grows | Can improve as system grows |
The MTTF approach breaks down at scale. Complex distributed systems have so many potential failure modes that preventing them all is impossible. The MTTR approach scales: invest in observability, automation, and response processes that work regardless of the specific failure.
MTTR and the Other DORA Metrics
MTTR is deeply connected to the other three DORA metrics:
Deployment Frequency → MTTR: More frequent deploys mean smaller changesets. Smaller changesets are easier to diagnose and roll back. Teams that deploy daily have inherently lower MTTR than teams that deploy monthly.
Lead Time → MTTR: Shorter lead times mean hotfixes ship faster. If a forward-fix takes 2 hours to go from commit to production instead of 2 weeks, your MTTR for non-rollback-eligible issues drops dramatically.
Change Failure Rate → MTTR: A lower CFR means fewer incidents to respond to, which means less alert fatigue and more capacity for each response. However, investing heavily in CFR reduction at the expense of MTTR improvement is a common mistake.
Tools for Measuring MTTR
To measure MTTR accurately, you need:
- Incident tracking with timestamps (PagerDuty, Opsgenie, or even a well-maintained spreadsheet)
- Deployment tracking with timestamps (CI/CD pipeline data)
- Correlation between deployments and incidents
PanDev Metrics connects to your Git provider (GitLab, GitHub, Bitbucket, Azure DevOps) and correlates deployment events with incident data to calculate MTTR automatically. The AI assistant (powered by Gemini) can analyze your incident patterns and suggest specific interventions based on your team's data.
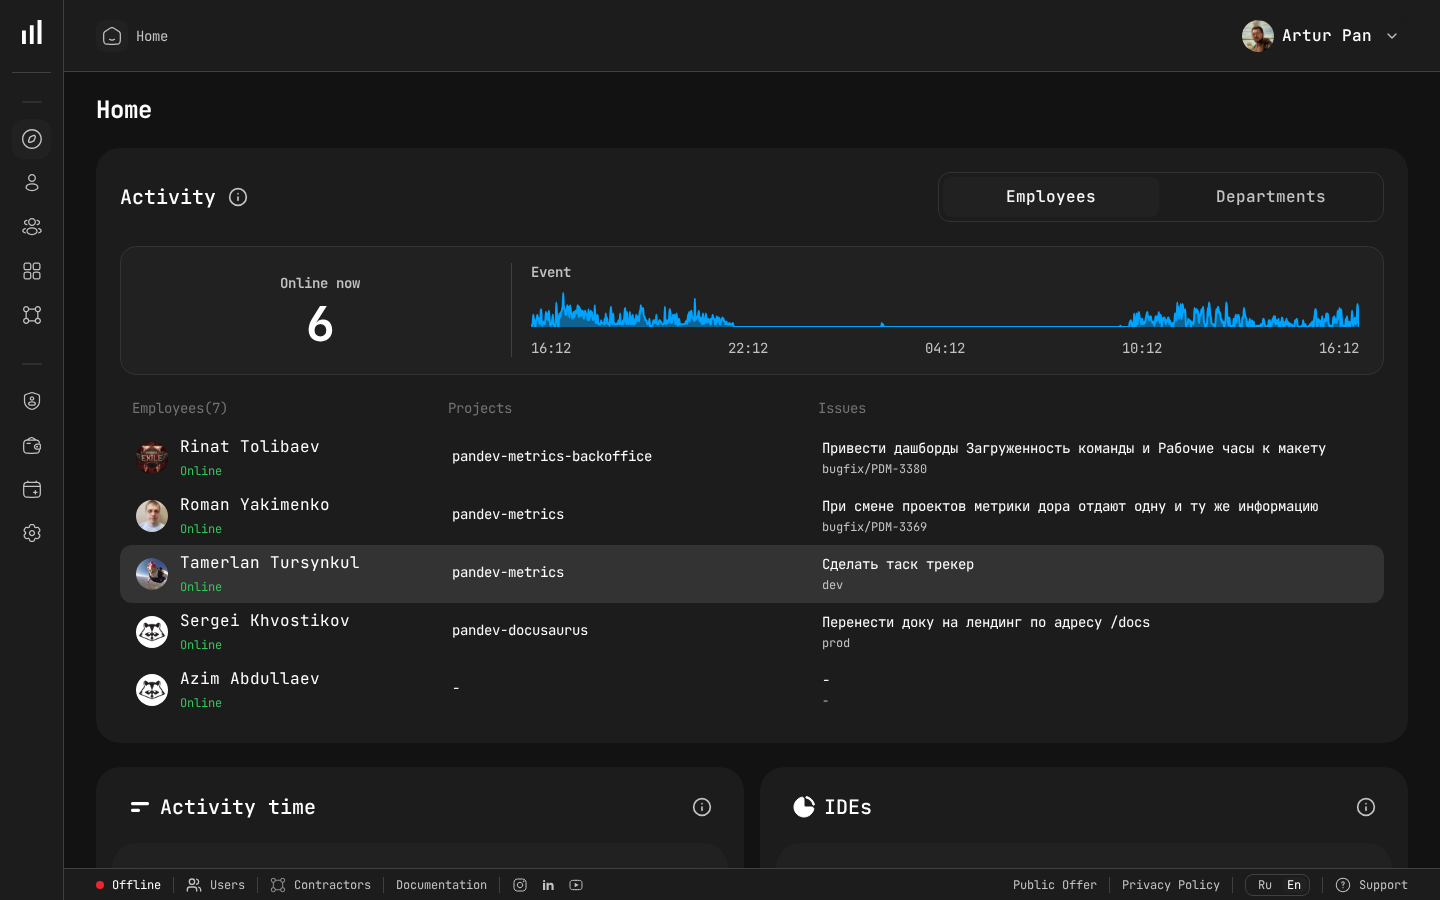
Team dashboard showing online status and event timeline for incident response tracking.
The Bottom Line
MTTR is the most underrated DORA metric. Teams pour resources into prevention (testing, review, QA) while neglecting recovery (monitoring, rollback, runbooks, practice). The data is clear: elite teams don't prevent all failures. They recover from failures so fast that most users never notice.
If you could improve only one DORA metric, improve MTTR. Fast recovery makes every other metric more forgiving. High Change Failure Rate? Less painful if you recover in 15 minutes. Low Deployment Frequency? Less risky to increase if you know you can roll back instantly.
Invest in the emergency room, not just preventive medicine.
Benchmarks from the DORA State of DevOps Reports (2019–2023), published by Google Cloud / DORA team. Philosophy influenced by the Google SRE book (2016).
Want to track MTTR alongside all four DORA metrics? PanDev Metrics correlates your deployment and incident data to calculate recovery time automatically — and the AI assistant identifies patterns in your incidents. Measure recovery speed →