Observability Stack: Datadog vs Grafana vs Honeycomb

An SRE lead at a mid-size fintech told me the quote that defines 2026 observability decisions: "Datadog is the iPhone of observability — expensive, polished, and I wish I had a choice." The market has three credible positions now: Datadog as the integrated default, Grafana as the open-source-first alternative, and Honeycomb as the wide-events specialist. Each is optimized for a different failure mode, and picking the wrong one doesn't show up in the first quarter — it shows up as a $2M annual bill and a team that still can't answer "why was latency spiky on Tuesday?"
CNCF's 2024 Annual Survey reported that 86% of cloud-native organizations use OpenTelemetry in some form — which sounds like the market is standardizing. In practice OTel is a pipeline, not a destination; every shop running it still picks one of these three stacks (or Splunk, New Relic, Dynatrace — we'll touch those briefly) to actually store, query, and visualize the data. Honeycomb's own observability maturity research shows that teams adopting wide-events cut investigation time on novel incidents by 40-60%, but only when the culture adapts — tooling alone doesn't deliver the lift.
{/* truncate */}
Positioning
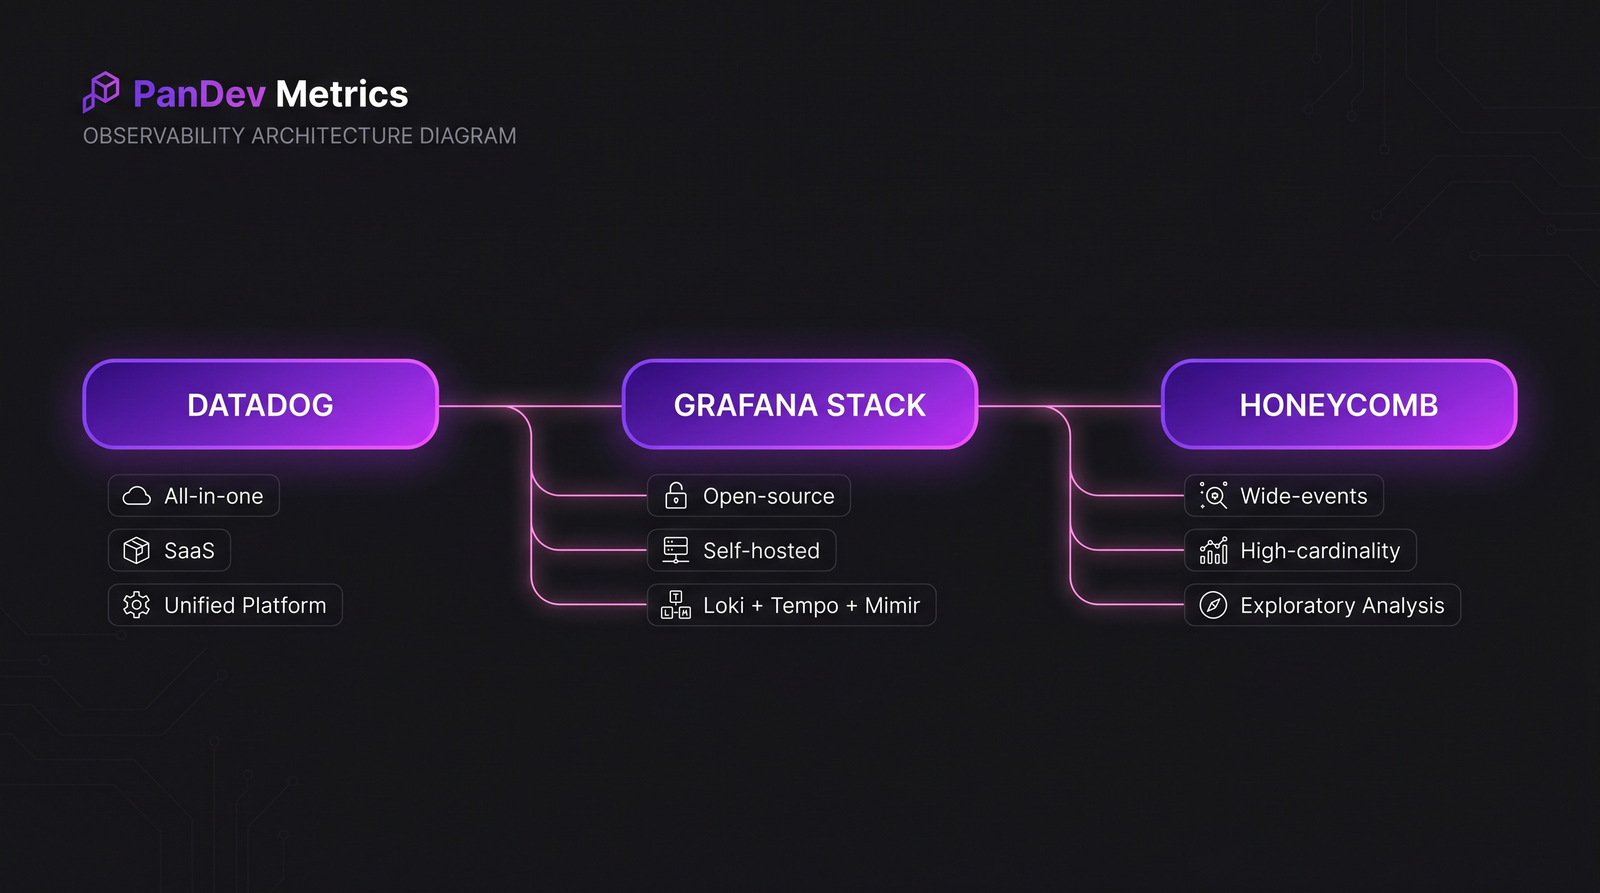
Datadog. All-in-one SaaS. Infrastructure monitoring, APM, logs, RUM, synthetic, security, CI visibility — one UI, one bill, consistent query language across pillars. The biggest market share, the most integrations, and the highest per-unit cost.
Grafana stack (Loki + Tempo + Mimir + Grafana Cloud or self-hosted). Open-source first, with a managed cloud option. Best-in-class at price-per-GB for logs and metrics at high volume. The cost of flexibility is that you're assembling a system, not buying one.
Honeycomb. Wide-events-first. Designed around the assumption that the interesting question is unknown in advance, so you store everything with high cardinality and slice after the fact. Best-in-class for debugging novel production incidents. Narrower scope than the other two — no infrastructure monitoring, no RUM.
 The three tools aren't direct substitutes. Picking one against the others is usually picking which failure mode you can afford to have.
Feature-by-feature comparison
Pillar coverage
| Pillar | Datadog | Grafana stack | Honeycomb |
|---|---|---|---|
| Metrics | Native, first-class | Mimir (best-in-class at scale) | Derived from events |
| Logs | Native | Loki | Via ingest; not the primary shape |
| Traces (APM) | Native APM | Tempo | Native wide-events (traces are a subset) |
| RUM | Native | Faro | No |
| Synthetic monitoring | Native | k6 Cloud | No |
| Infrastructure monitoring | Native | Various exporters | No |
| CI visibility | Native | Limited | No |
| Security monitoring (SIEM) | Native | Limited | No |
Datadog's single-vendor story is real — if you want one tool that covers every pillar, Datadog is the only option in the comparison. Grafana can match on most pillars but requires assembly. Honeycomb deliberately doesn't try.
Query-language power
| Capability | Datadog | Grafana | Honeycomb |
|---|---|---|---|
| Metric queries (rate, avg, p99) | Excellent (DDSQL + legacy) | Excellent (PromQL) | N/A — not metric-first |
| Log querying | Good, SaaS-hosted | LogQL (Loki) — good but limited at scale | N/A |
| Trace exploration | Good, flamegraph-heavy | Tempo explorer — solid | Excellent — BubbleUp, slice-by-anything |
| Cardinality limits | Harsh on custom metrics | Harsh on Prometheus cardinality | Designed for high cardinality |
| Ad-hoc exploration | Moderate | Moderate | Category-leading |
Honeycomb's BubbleUp and slice-by-anything UI is the clearest differentiation in the market — ask "what's different about the slow requests vs the fast requests?" and get a ranked answer in seconds, across any field. Datadog added similar in 2024 (Error Tracking Explorer) but still lags on high-cardinality attributes.
Storage model
| Aspect | Datadog | Grafana | Honeycomb |
|---|---|---|---|
| Where data lives | Datadog's cloud | Your infra (or Grafana Cloud) | Honeycomb's cloud |
| Sampling strategy | Index + retention tiers | Retention by table | Deterministic + dynamic sampling |
| Retention (default) | 15 months metrics, 15 days logs | Configurable | 60 days (events) |
| Data residency | US / EU / JP regions | Wherever you deploy | US / EU |
For regulated industries — fintech, healthcare, defense — the "wherever you deploy" story is decisive. Grafana self-hosted is the only option in the comparison that lets engineering telemetry never leave your perimeter. This is the same reason our on-prem customers often pair PanDev Metrics with self-hosted Grafana rather than with Datadog.
The pricing reality
Published list prices, compared on a realistic mid-size (150-engineer) workload. Actual enterprise pricing is always negotiated — expect 20-40% off list for committed usage, more at large scale.
Typical annual cost at 150 engineers / 500 services / moderate volume
| Cost component | Datadog | Grafana Cloud | Grafana self-hosted | Honeycomb |
|---|---|---|---|---|
| Infra monitoring | $75-120K | $30-50K | Infra cost only | N/A |
| APM / traces | $60-120K | $25-45K | Infra cost only | $50-100K |
| Logs | $80-200K | $30-80K | Infra cost only | N/A (events) |
| RUM + Synthetic | $25-60K | $15-30K | Infra cost | N/A |
| Engineer time (operate) | Minimal | Moderate | 1-2 FTE | Minimal |
| Total realistic | $250-500K | $100-200K | $80-150K + FTE | $50-100K |
Honeycomb looks cheapest on this table because it doesn't compete on all pillars — comparing a focused wide-events tool to a full-suite one is apples to oranges. The honest read is that a "Honeycomb + something else" stack costs $150-250K, competitive with Grafana and cheaper than Datadog.
Hidden costs
| Gotcha | Datadog | Grafana | Honeycomb |
|---|---|---|---|
| Custom metric overages | Severe — $0.05 per metric per month stacks | Cardinality limits cause OOM, not overage | None |
| Log volume spikes | Billed by ingest GB | Storage + query cost | Not applicable |
| New-feature creep | Every new product adds a line item | Open-source, but managed tier adds cost | Focused product scope |
| Multi-region | Surcharge on enterprise | Free with self-host | Surcharge |
Datadog's pricing compounds by headcount AND by product adoption. Teams that join Datadog at 50 engineers and grow to 200 routinely see their annual bill triple, because the engineering teams ship more services, which triggers more custom metrics, which triggers more infrastructure monitoring, which triggers more log volume.
Decision framework
Choose Datadog if:
- You need one tool that covers every observability pillar and you can't spare engineering cycles to integrate three
- Your engineering org is < 100 people and you're growing fast (Datadog scales without operator burden)
- Security / compliance wants one auditable vendor, not four
- You're on the cloud (AWS / GCP / Azure) and never plan to move off
Choose Grafana (self-hosted or Cloud) if:
- You have 1-2 FTEs who can own observability infrastructure
- Cost per GB matters more than time-to-value (you're at > 100TB/mo)
- You need data residency control (on-prem, sovereign cloud, regulated industry)
- You've standardized on OpenTelemetry and want to avoid vendor lock-in on the query layer
Choose Honeycomb if:
- Your incident-investigation time is the bottleneck, and you want wide-events first
- You already have infrastructure / RUM handled elsewhere
- Your team has the discipline to instrument wide events (not just metrics)
- Production mysteries are more common than reliability problems
The integrated-stack alternative (honest mention)
Splunk, New Relic, and Dynatrace don't appear in most 2026 greenfield discussions but remain dominant in enterprise. Splunk owns security + logs in Fortune 500. New Relic pivoted to usage-based pricing in 2020 and is competitive on APM for smaller teams. Dynatrace owns the APAC enterprise market and has the best AI-driven auto-instrumentation. For a startup or mid-size company in 2026, the three tools we compared are the real decision; for a 50,000-engineer bank, the conversation is usually Datadog vs Splunk vs Dynatrace with Grafana self-hosted as the open-source escape valve.
Summary matrix
| Dimension | Datadog | Grafana | Honeycomb |
|---|---|---|---|
| Pillar coverage | Best | Good (with assembly) | Narrow (events) |
| Cost at scale | Expensive | Cheapest (self-host) | Moderate |
| Ease of operation | Best | Moderate (self-host: hard) | Best |
| Data residency | Limited regions | Anywhere | Limited regions |
| High-cardinality debugging | Moderate | Moderate | Best |
| Time-to-value | Fastest | Slowest (self-host) | Fast |
| Vendor lock-in risk | High | Low | Moderate |
| Suitability for 50-500 eng | Good | Moderate | Good (as one tool of stack) |
| Suitability for 5,000+ eng | Expensive | Good | Good (as one tool of stack) |
The contrarian take
The observability market narrative frames tool choice as a rational cost-benefit analysis. It isn't. Tool choice is an organizational identity statement: Datadog shops tend to have strong product engineering and thin SRE bench; Grafana shops tend to have strong platform engineering and invest in building; Honeycomb shops tend to have engineers who read academic papers about observability theory. The tools succeed because they match a culture. The common failure mode isn't picking the "wrong" tool — it's picking a tool that doesn't match the culture you have, then blaming the tool when adoption stalls. Before the feature comparison, ask which culture describes your engineering org today.
The honest limit
Our direct observation is on 60+ engineering teams running various observability stacks — most commonly some combination of Datadog + Grafana + self-hosted Prometheus. Our Honeycomb signal is thinner (3-5 teams, all in the US or EU). Pricing estimates above come from published list prices, customer conversations, and public contract disclosures; actual enterprise negotiated pricing can be materially different and changes faster than any blog post can track. The query-language and UX assessments reflect 2026-Q2 state — all three vendors ship substantial features quarterly, so anything specific to UI affordances is best verified against current docs before committing.
Where PanDev Metrics fits
PanDev Metrics is an engineering-intelligence platform, not an observability platform — we operate one layer higher. We consume signals from observability stacks (commit → CI → deploy → alert) rather than competing with them. The DORA metrics we produce need deployment events and incident timestamps, both of which flow through your observability tool. Our data shows that engineering teams running Grafana self-hosted alongside PanDev Metrics on-prem cluster around data-residency requirements — the same reason to self-host observability is often the reason to self-host engineering-intelligence.
Related reading
- Top 15 Engineering Intelligence Tools in 2026: Complete Market Comparison — the adjacent market (engineering-intelligence, not observability) with its own vendor landscape
- MTTR: Why Speed of Recovery Matters More Than Preventing All Incidents — the metric that tool choice ultimately moves or doesn't move
- PanDev Metrics vs Sleuth: Beyond DORA Tracking — adjacent comparison for the DORA + deployment-events layer that sits above observability
- External: CNCF Annual Survey — Observability adoption trends — the public reference for market-wide direction