How Outsourcing Companies Prove 160 Hours Are Actually 160 Hours

The Deloitte Global Outsourcing Survey consistently identifies "lack of visibility" as one of the top reasons outsourcing relationships fail. Your client pays for 160 hours per month per developer. But deep down, they wonder: were those really 160 hours of productive work? This single doubt has killed more outsourcing contracts than missed deadlines.
The problem isn't trust — it's the absence of proof.
{/* truncate */}
The 160-Hour Problem
Every outsourcing CEO knows this scenario. You invoice the client for a full-time developer. The client looks at the deliverables and thinks: "This doesn't look like 160 hours of work." Maybe the feature was smaller than expected. Maybe there were bugs. Maybe the developer spent 40 hours on refactoring that's invisible to a non-technical stakeholder.
Without evidence, you're stuck in a "he said, she said" situation. And every time you say "trust us," you lose a little credibility.
Why traditional time tracking fails
Most outsourcing companies rely on one of these approaches:
| Method | What the client sees | The trust problem |
|---|---|---|
| Self-reported timesheets | "8 hours — worked on feature X" | Anyone can write anything |
| Screenshot tools | Random screenshots every 10 minutes | Invasive, easy to game, doesn't prove productivity |
| Jira/ticket tracking | Task moved to "Done" | Doesn't show how long it actually took |
| Honor system | Nothing | Maximum doubt |
None of these answer the fundamental question: was the developer actually writing code during those hours?
What "Proof" Actually Means to a Client
Before building a proof system, you need to understand what clients actually want to see. After working with dozens of outsourcing companies, we've identified three levels of proof:
Level 1: Activity Existence
The developer was active in the IDE on specific dates and times. This is the bare minimum — evidence that someone opened an editor and did something.
Level 2: Activity Depth
How much time was spent coding vs. idle. Which projects and files were touched. What languages and frameworks were used. This level gives the client confidence that work was happening on their project specifically.
Level 3: Activity Context
Correlation between coding activity and delivered results. Cost per feature, sprint, or time period. Trends over weeks and months. This is the gold standard — it turns raw activity into a business narrative the client can understand.
The IDE Heartbeat Approach
Modern engineering intelligence platforms track developer activity through IDE heartbeats — lightweight signals sent from the developer's code editor every few minutes while they're actively working.
Here's how it works:
- A plugin runs inside the IDE (VS Code, IntelliJ, WebStorm, etc.)
- While the developer types, navigates, or debugs, the plugin sends a heartbeat with metadata: timestamp, project name, language, file type
- When the developer is idle (no keyboard/mouse activity), no heartbeat is sent
- The platform aggregates heartbeats into daily, weekly, and monthly activity summaries
This is fundamentally different from screenshot monitoring:
| Screenshots | IDE Heartbeats | |
|---|---|---|
| What's captured | Screen image | Activity metadata only |
| Privacy | Low — captures personal data | High — no screen content |
| Accuracy | Point-in-time snapshot | Continuous tracking |
| Gameable? | Yes (mouse jigglers, fake screens) | Extremely difficult |
| Developer acceptance | Low — feels like surveillance | High — runs silently |
Building a Proof System: Step by Step
Step 1: Deploy IDE Plugins Across Your Team
The first step is getting every developer on a standardized tracking setup. With PanDev Metrics, this means installing an IDE plugin that takes under 2 minutes. The plugin supports all major editors: VS Code, Cursor, all JetBrains IDEs, Visual Studio, Vim, and others.
Key consideration: developers must understand this is about billing proof, not surveillance. Frame it as a tool that protects them too — when a client questions hours, the data speaks for itself.
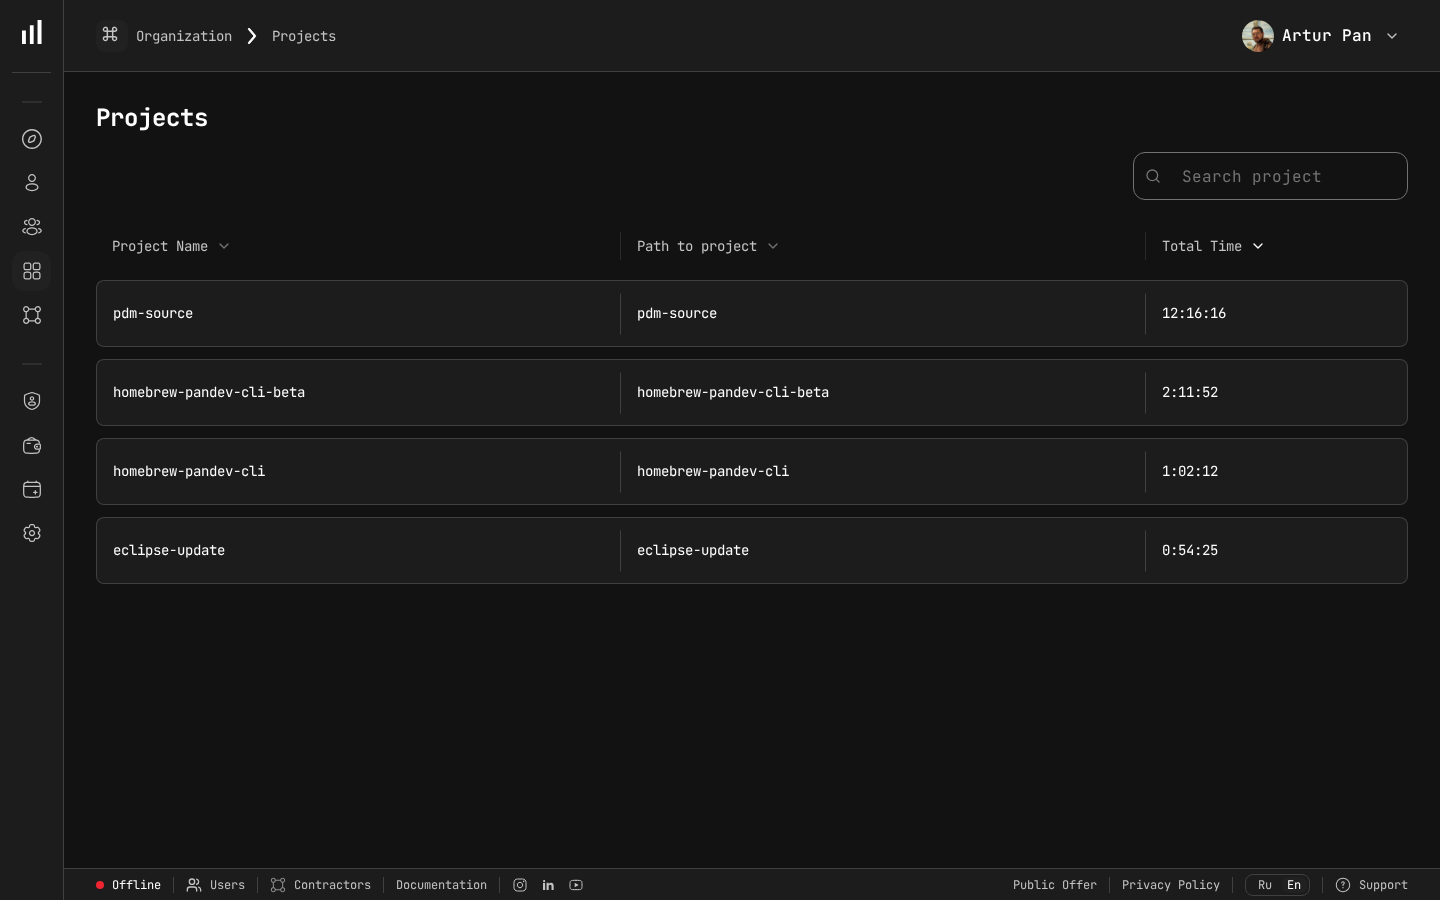 The Projects view shows tracked time per project — exactly the data clients need to verify billed hours.
Step 2: Map Developers to Projects and Clients
Configure your system so every developer's activity is associated with the correct client project. In PanDev Metrics, this happens automatically through project name detection — the IDE plugin reads the project/workspace name and maps it accordingly.
For teams working on multiple client projects, this separation is critical. You need to prove not just that a developer worked 160 hours, but that they worked 160 hours on this specific client's project.
Step 3: Set Hourly Rates and Cost Tracking
Once activity is tracked per project, attach hourly rates to each developer. This gives you:
- Actual cost per project per month — based on real hours, not estimates
- Cost per developer per client — useful when one developer splits time between clients
- Budget burn rate — how fast the client's monthly budget is being consumed
Step 4: Generate Client-Ready Reports
The report your client receives should include:
- Total active hours per developer for the billing period
- Daily breakdown showing when work happened
- Project-specific hours if the developer works on multiple projects
- Activity summary — languages used, relative intensity of work
PanDev Metrics offers one-click Excel export for exactly this purpose. You download the report, attach it to the invoice, and the client has complete visibility.
Step 5: Provide Ongoing Dashboard Access (Optional)
Some companies go further and give clients read-only access to a real-time dashboard. This is a bold move, but it eliminates doubt entirely. The client can log in at any time and see:
- Which developers are currently active
- How many hours have been logged this month so far
- Activity trends and patterns
Real-World Example: Before vs. After
Consider a mid-sized outsourcing company with 40 developers serving 8 clients.
Before implementing activity tracking:
- 2-3 billing disputes per quarter
- Average time to resolve a dispute: 2 weeks
- Client retention rate: 70% annually
- Sales cycle for new clients: 3+ months (trust was a barrier)
After implementing IDE-based activity tracking:
- Billing disputes dropped to near zero — the data spoke for itself
- Client retention improved significantly — clients felt they had full visibility
- Sales cycle shortened — the transparency pitch became a differentiator
- Developer satisfaction increased — no more screenshot surveillance
These results are consistent with IAOP (International Association of Outsourcing Professionals) findings showing that outsourcing providers who invest in transparency mechanisms retain clients at materially higher rates than those relying on traditional reporting.
Handling Developer Concerns
When you introduce activity tracking, developers will have questions. Here are honest answers:
"Are you spying on me?" No. IDE heartbeat tracking captures metadata — project name, language, timestamps. It doesn't record screen content, keystrokes, or file contents. It's less invasive than a Git log.
"What if I'm thinking, not typing?" Good point. Coding isn't 100% typing. The system tracks active IDE time, which naturally includes short pauses for thinking. However, extended breaks (15+ minutes without activity) won't be counted. This is by design — you're tracking work time, not total sitting time.
"Will this be used against me?" Set a clear policy. Activity data is for client billing and project management — not for ranking or punishing individual developers. Put this in writing.
"What about non-IDE work?" Code reviews, architecture discussions, and Slack conversations aren't captured by IDE tracking. Make this clear to clients too — the tracked hours represent coding time specifically, and total work time is higher.
The Financial Impact
According to Forbes Kazakhstan, switching to hourly tracking based on real IDE activity data can reduce labor costs by 25-30%. — Forbes Kazakhstan, April 2026
Let's do some math. A typical outsourcing company billing $50/hour per developer with a 40-person team:
- Monthly revenue: 40 × 160 × $50 = $320,000
- Revenue at risk from 1 lost client (5 devs): $40,000/month = $480,000/year
- Cost of implementing activity tracking: a fraction of one month's revenue from a single developer
Even if tracking prevents the loss of just one small client per year, the ROI is overwhelming.
But the real value isn't defensive. Companies that lead with transparency win new deals faster. When your sales pitch includes "you'll see real-time activity data for every developer we assign to your project," you immediately stand out from competitors who say "trust us."
Common Mistakes to Avoid
Mistake 1: Tracking without explaining why
If developers learn about tracking from IT rather than management, they'll assume the worst. Hold a team meeting. Explain the business reason. Show them what the client sees.
Mistake 2: Treating tracked hours as the only metric
IDE activity is one dimension of productivity. A senior developer who codes 4 hours a day but architects solutions that save 100 hours of rework is more valuable than someone who types for 8 hours. Use activity data for billing proof, not performance evaluation.
Mistake 3: Hiding the data from developers
Give developers access to their own dashboards. When they can see their own patterns, they self-optimize. This turns tracking from a surveillance tool into a self-improvement tool.
Mistake 4: Over-reporting to clients
Clients want a clear summary, not a minute-by-minute log. A one-page monthly report with total hours, daily averages, and project breakdown is enough. Too much data creates noise.
Making Transparency Your Standard Operating Procedure
The companies that thrive in outsourcing are the ones that make transparency automatic, not optional. Here's how to make it part of your DNA:
- Onboarding: Every new developer installs the IDE plugin on day one
- Monthly billing: Every invoice includes an activity report as a standard attachment
- Quarterly reviews: Use trend data to show clients how their team has grown and improved
- Sales process: Demo your tracking dashboard during the pitch
When transparency is the default, clients stop questioning hours. They start questioning why their previous vendor didn't offer this.
Key Takeaways
- The 160-hour trust gap is the biggest silent killer of outsourcing contracts
- Self-reported timesheets and screenshot tools don't provide credible proof
- IDE heartbeat tracking offers non-invasive, continuous, accurate activity data
- The proof system should cover activity existence, depth, and business context
- Transparency doesn't just retain clients — it wins new ones faster
- Developers accept heartbeat tracking far more readily than screenshot surveillance
Stop losing clients to doubt. PanDev Metrics gives your outsourcing company IDE-based activity tracking, automated cost calculation, and one-click Excel reports — so every billed hour has proof behind it.