Overhead Coefficient: The Hidden Tax Per Developer

A 50-person engineering org we instrumented in February 2026 had a monthly overhead coefficient of K = 0.37. That means every $1 of direct development work was shadowed by 37 cents of indirect cost: meetings, code review, ramp-up, and a slice of CTO/EM/DevOps salary spread across the team. The CFO had been modelling overhead at a flat 30% loaded multiplier for three years. The actual number was 23% higher, and almost nobody in the company knew.
The bigger problem was not the gap. The bigger problem was that the 30% number was a single bucket, so even after you discovered the gap, there was nothing actionable inside it. Boston Consulting Group's 2024 report on G&A allocation in software firms made the same observation at industry scale: companies that report overhead as one line item find it nearly impossible to trim, while companies that decompose it into three components reduce it by 8–15% within two quarters.
{/* truncate */}
Why a flat multiplier hides the actionable cost
The standard finance treatment of engineering overhead is some version of "salary × 1.3 = loaded cost". That works for a payroll line. It collapses for any decision more granular than headcount budgeting.
McKinsey's 2023 Tech Talent Tectonics report quantified the spread: top-quartile engineering organizations achieve 4–5x more revenue per engineer than bottom-quartile, and the gap correlates more strongly with how cleanly direct work is separated from indirect work than with raw headcount or salary level. You cannot improve what you cannot see, and a single coefficient hides three very different things.
Pull the bucket apart and you find three components:
| Component | What it is | Reducible? |
|---|---|---|
| taskTotal | Direct development time linked to a Jira issue or ticket | Hard — this is the actual work |
| nontaskTotal | Meetings, code review, research, ramp-up, "no-issue" coding | Yes — operational |
| adminSalary | Shared management overhead (CTO, EM, DevOps, architects) | Partially — structural |
Only one of these, nontaskTotal, is realistically actionable inside a single quarter. The other two are either the work itself or organizational architecture that doesn't change without restructuring. Treating all three as one number means a CFO asking "can we cut overhead?" gets a shrug. Treating them separately means the answer is "yes, by 28% of the meeting line, here's the recurring-meeting list to audit".
The formula, monthly, no averaging
PanDev Metrics computes the overhead coefficient per (department_id, year, month) using a flat formula:
K = adminSalary / (taskTotal + nontaskTotal)
Three things matter about this definition:
- Per month, not averaged. Averaged K is meaningless because nontaskTotal swings seasonally: Q4 planning, January re-baselining, summer vacation gaps all show up. We saw this in our own data and it cost us six months of mistaken targets when we used a yearly average.
- adminSalary is configured, not measured. It's the fixed share of CTO + EM + DevOps + architect salaries allocated to a department. It does not move with sprint velocity. That's a feature: it surfaces structural cost separately from operational cost.
- The denominator is total tracked engineering effort. taskTotal comes from IDE heartbeat telemetry joined to Jira
issue_key. nontaskTotal comes fromf_mv_activity_total_user_daily_todayfiltered to rows without a linked issue: meeting blocks, free-form research, code review on someone else's branch.
Underneath, OverheadCoefficientCronJob runs daily and incrementally updates the current month. When historical rates change (for example, when an engineer's salary or department changes), OverheadCoefficientFullRecalcCronJob rebuilds the full history. We learned the hard way that without a recalc job, a single retroactive HR change silently corrupts six months of finance reports.
For a deeper walkthrough of how taskTotal and nontaskTotal feed into the loaded-rate calculation, see Loaded Hourly Rate: The True Cost of an Engineer Hour. For how mixed-rate teams (contractors on hourly, FTEs on monthly) flow into K, see Hourly vs. Monthly Rate in Mixed Engineering Teams.
Three departments, three different K values
The single most useful exercise once you compute K per department is comparing them side by side. Here is the same 50-person engineering org broken out across three teams in February 2026:
| Department | taskTotal | nontaskTotal | adminSalary | K | Note |
|---|---|---|---|---|---|
| Backend (18 engineers) | $76K | $24K | $32K | 0.32 | Heavy autonomous coding, low meeting load |
| Frontend (16 engineers) | $61K | $28K | $30K | 0.34 | Slightly more design syncs, similar admin |
| Data (8 engineers) | $24K | $14K | $18K | 0.47 | Small team, fixed adminSalary spreads thin |
Same company, same management style, K ranges from 0.32 to 0.47. The Data team's K is 47% higher than Backend's not because Data engineers are inefficient, but because adminSalary is a fixed cost spread over fewer billable hours. This is structural overhead and it mostly cannot be cut; it can only be amortized by growing the team or accepting it as the cost of having specialists.
The actionable signal in this table is Frontend's nontaskTotal running 15% higher than Backend's. That's the operational lever.
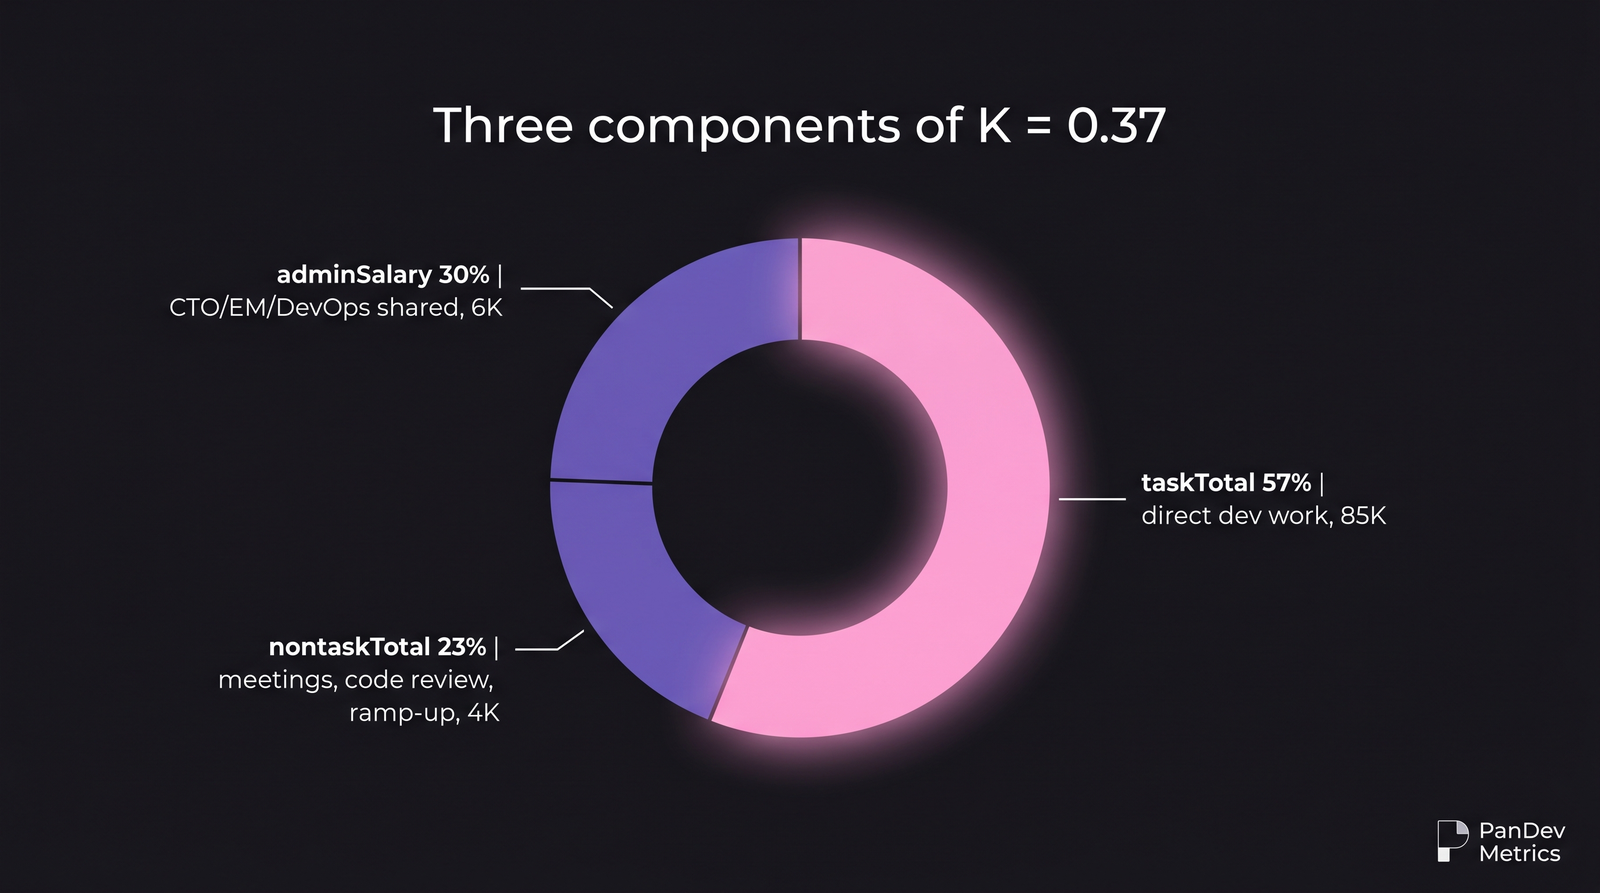 Three components of K. Only the middle slice is operationally reducible inside a quarter.
K swings by month, and that's the point
The second exercise that pays for itself is plotting K month-by-month for one team. Here's the Frontend team across a full year:
| Month | taskTotal | nontaskTotal | adminSalary | K | Driver |
|---|---|---|---|---|---|
| Jan | $48K | $32K | $30K | 0.38 | New OKR planning, re-baselining |
| Feb | $61K | $28K | $30K | 0.34 | Steady state |
| Mar | $63K | $26K | $30K | 0.34 | Steady state |
| Apr | $58K | $27K | $30K | 0.35 | Easter / vacation start |
| May | $62K | $25K | $30K | 0.34 | Steady state |
| Jun | $55K | $24K | $30K | 0.38 | Vacation dip in numerator |
| Jul | $49K | $22K | $30K | 0.42 | Peak vacation, K rises |
| Aug | $54K | $23K | $30K | 0.39 | Recovery |
| Sep | $64K | $27K | $30K | 0.33 | Strong autumn cycle |
| Oct | $66K | $29K | $30K | 0.32 | Best month of year |
| Nov | $58K | $32K | $30K | 0.33 | Pre-Q4 push, more meetings |
| Dec | $42K | $34K | $30K | 0.39 | Holiday lull + planning meetings |
January K runs 12% above the steady-state baseline. Q4 December runs 18% above. Anyone budgeting on a flat annual K is over-charging the busy months and under-charging the slow ones. That makes per-feature cost reports bounce up to 25% off reality between January and October even when no underlying work changed.
The contrarian implication: the right unit of measurement for engineering overhead is the rolling 3-month K, not the annual average. A flat year-end coefficient hides a swing that's larger than most efficiency programs ever produce.
Where the actionable cuts live
Of those three components, only nontaskTotal moves on a quarterly horizon. The detail underneath it is where finance leaders should focus.
In the 50-person org, nontaskTotal = $74K. The breakdown looked like this:
| Sub-category | $ | Share |
|---|---|---|
| Recurring meetings (standup, planning, retro) | $21K | 28% |
| Code review on others' branches | $18K | 24% |
| Ad-hoc syncs and 1:1s | $15K | 20% |
| Research / spike work without issue | $11K | 15% |
| Ramp-up and pair programming | $9K | 12% |
The 28% on recurring meetings was the headline. None of those meetings were architectural. They were operational, calendar-inertia events that nobody had cancelled in 18 months. A 90-minute weekly sync that nine engineers attended was costing $4.2K per month at the team's loaded rate. Cancelling it didn't break anything. Two months later K had dropped from 0.37 to 0.33, a 10% reduction in overhead with zero process redesign and zero headcount change.
This is the contrarian point: most engineering overhead is not architectural and not strategic; it's calendar inertia that finance can audit the same way it audits a SaaS bill. Doodle's 2024 State of Meetings report, drawing on calendar telemetry from 6,500 organizations, put the cost of unnecessary recurring meetings at $25,000 per employee per year for knowledge workers. The number sounds inflated until you compute it from your own K and watch it land within 10–15% of Doodle's range.
For the operational levers around context-switching and multi-project tax that compound this, see our earlier piece on Engineering ROI: How to Actually Measure It.
What our K data does not tell you
Computing K accurately requires reliable separation of task vs. non-task time. If your team can't tag meeting time or doesn't link IDE activity to Jira issues, K will be biased high: too much time falls into "unclassified", which the system treats as nontaskTotal, inflating the numerator's pressure and overstating overhead. We've seen orgs new to the platform run K = 0.55 in their first month and watch it settle to 0.34 by month three as Jira hygiene improves.
A second limit: K is a finance metric, not a productivity metric. A team with low K is not necessarily more productive. They may be skipping code review, deferring documentation, or accumulating tech debt that will surface as elevated nontaskTotal six months later. The right read of K is "what share of paid engineering time is captured in shippable work this month", which is a cost-allocation question, not a quality question.
A third limit: adminSalary allocation is an accounting choice. There is no objectively correct way to split a CTO's salary across three departments. Whatever method you pick (headcount-weighted, salary-weighted, time-tracked involvement), apply it consistently. The trend in K matters more than the absolute level, and the trend is only meaningful if the allocation rule doesn't change underneath you.
How to use K in your finance review
The fastest payoff is to do three things this quarter:
- Compute K per department per month for the trailing 12 months. If you've been running PanDev Metrics or any equivalent IDE-tracking platform, this query is a single SQL join. If not, the inputs are still recoverable from Jira time-tracking (proxy for taskTotal), calendar API (proxy for meeting nontaskTotal), and your HR system (adminSalary).
- Plot K month-by-month, not as an annual average. Look for the seasonality. Most teams see January and Q4 spikes of 12–20%. Anyone forecasting per-feature cost without that profile is off by the size of the spike.
- Audit
nontaskTotalonce a year. Pull the recurring-meeting list, the code-review-shadow load, and the no-issue coding hours. The 28% recurring-meeting share is rarely defensible under scrutiny. We've never seen a team audit this and not find at least three meetings to cancel.
For the broader CFO frame around how K plugs into the overall engineering finance dashboard, see CFO's Guide to Engineering Metrics: What to Ask and Why.
The number behind the number
The overhead coefficient is the cleanest single number a CFO can use to challenge the "engineering is expensive and there's nothing to do about it" line. Once K is decomposed, the conversation shifts from "are we overspending on engineering" to "which slice of overhead is this, and is it operational or structural". The first question has no answer. The second one usually does.
If your engineering finance reports still show overhead as a single line, the next step is mechanical: compute K for the last 12 months, decompose into the three components, and look at January and December against October. The gap will surprise you, and the gap is where the budget lives.