Payments and Banking Engineering: Compliance + Speed

A payments engineering director told me the sentence that captures the whole vertical: "We have two stopwatches running. One measures how fast we ship. The other measures how many years we'll be paying for the mistake we ship fast." Everything else in payments engineering is a tradeoff on that pair.
The Bank for International Settlements' 2024 Annual Economic Report documents that global cross-border payments cleared $190 trillion in 2023, with payment technology handling roughly 1.4 billion daily transactions. Nilson Report, the card-industry reference, tracks industry fraud losses at around $33 billion globally per year — that's roughly 6 basis points on card volume, paid for by the engineering quality of the platforms in the middle. An engineering team shipping a regression into the authorization path doesn't get fired for shipping slowly; they get fired for the 40-basis-point spike on the next week's reconciliation report.
{/* truncate */}
Why payments engineering is different
Three structural constraints define the discipline:
Money has to balance, and balance is non-negotiable. A SaaS feature that occasionally returns a stale value is a minor bug. A payment system that occasionally credits the wrong ledger is a compliance event with mandatory regulatory reporting. "Eventually consistent" is a design choice in consumer internet; in core banking it's a career-ending architectural mistake. Engineers transitioning from non-financial backgrounds usually take 6-12 months to internalize the difference between "we'll retry and it'll be fine" and "we need a compensating transaction with an audit trail."
Deploy velocity is not uniform — it's tiered by blast radius. A payments platform has four or five deployment classes with fundamentally different cadences. Treating all deploys with one DORA-number hides the only interesting question: are the safe-to-deploy-fast things happening fast, and are the risky things happening carefully?
Regulatory concurrency. You're governed simultaneously by card schemes (Visa, Mastercard, Mir, UnionPay), payment regulators (PCI-DSS globally, PSD2/PSD3 in EU, CBR in Russia, AFSA in Kazakhstan, FCA in UK), AML/KYC regimes, and sanctions screening (OFAC, EU, UK, Russian Rosfinmonitoring). Each has its own audit cycle, its own reporting cadence, and its own deploy-freeze expectations. Engineering coordination isn't an organizational concern — it's a compliance concern.
 Payments deploys aren't one number. They're a distribution across blast-radius classes, and the interesting metric is how tight the distribution is, not how fast the average is.
The 5 metrics that matter
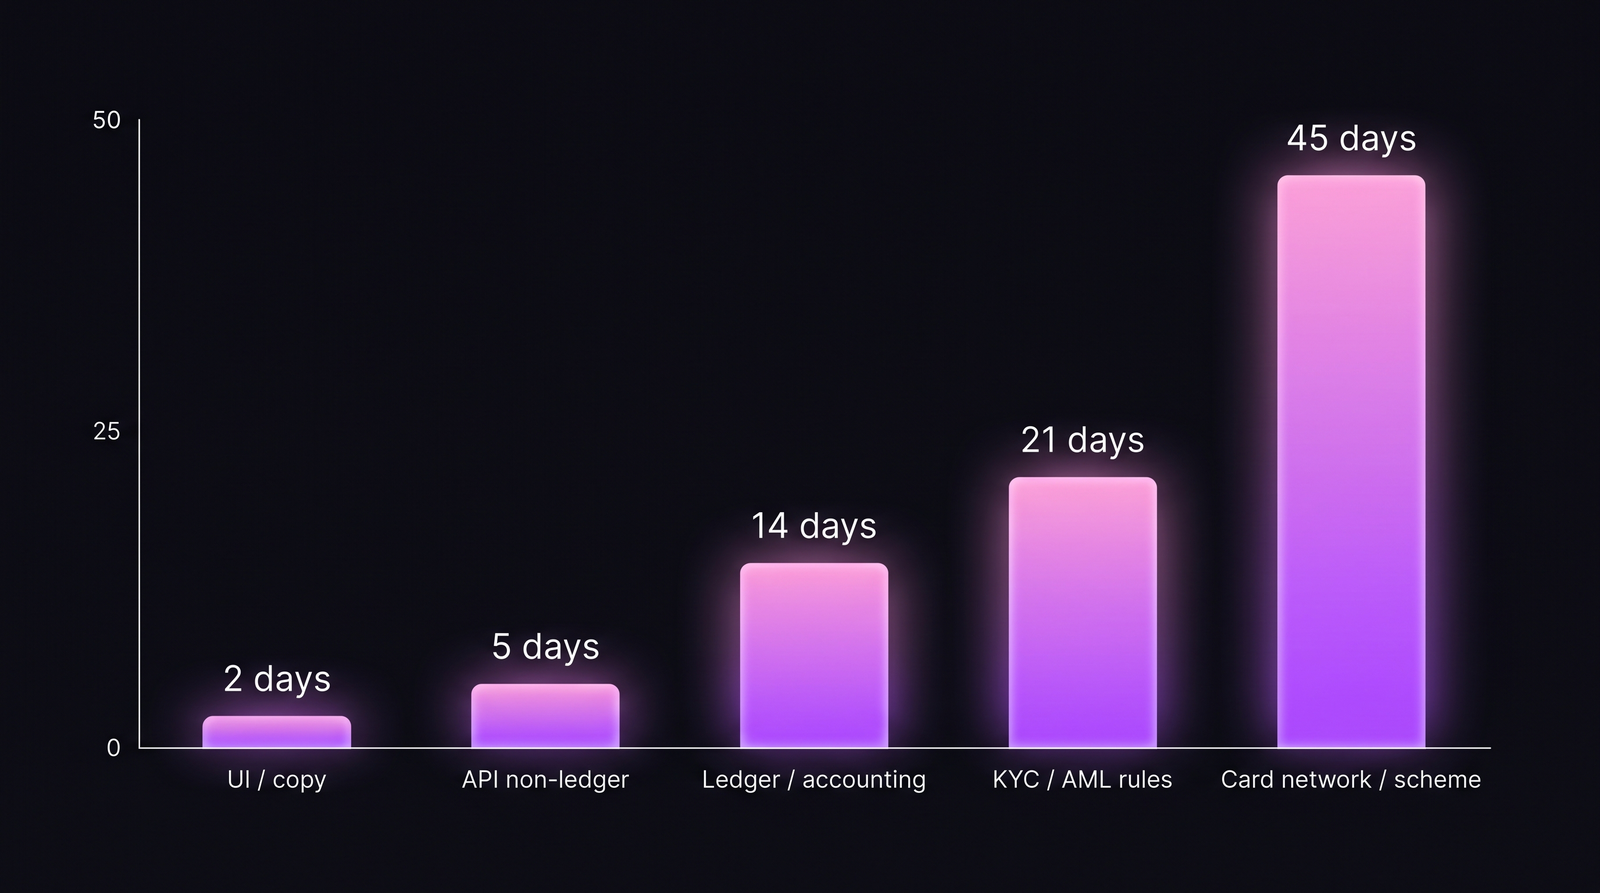
1. Segmented lead time for changes
The single biggest mistake in payments DORA is a blended lead-time number. It hides two opposite failure modes: UI changes stuck in a 30-day release train (too slow for the risk level) and ledger changes going through in 3 days (way too fast for the risk level). Our fintech DORA post covers the framework; the table below is the payments-specific version:
| Deploy class | Target lead time | Healthy ceiling | Red-flag floor |
|---|---|---|---|
| Marketing / content | 1-3 hours | 1 day | N/A |
| UI / customer-facing (no-ledger) | 1-3 days | 1 week | < 2h (likely skipping review) |
| API (non-ledger) | 3-7 days | 2 weeks | < 1 day (likely skipping SoX) |
| Ledger / accounting | 10-21 days | 30 days | < 7 days |
| KYC / AML rule engine | 14-30 days | 60 days | < 10 days |
| Card scheme / network cert | 30-60 days | 90 days | < 21 days |
The "red-flag floor" is the key number most teams ignore. A 3-day ledger deploy is as much a compliance problem as a 60-day UI deploy. Regulators will ask for the review evidence either way; fast + undocumented is worse than slow + documented.
2. Reconciliation break rate
Reconciliation is the daily (or intraday) process that confirms that every money movement in your system matches the corresponding entry at the counterparty — card network, acquirer, bank, FX provider, or ledger. Reconciliation breaks are small numerical deltas that should be zero but aren't.
| Reconciliation type | Acceptable break rate | Where good teams operate |
|---|---|---|
| Card acquirer daily | < 0.05% of transaction count | 0.01-0.03% |
| FX provider daily | < 0.1% | 0.02-0.05% |
| Bank statement weekly | < 0.02% | 0% for weeks, then a 1-transaction blip |
| Scheme interchange monthly | < 0.5% of amount | 0.05-0.15% |
| Internal ledger intraday | 0% | 0% (anything else is an incident) |
Engineering is accountable for the first four. The fifth is where "eventually consistent" becomes a line you can't cross: internal ledger breaks are incidents, not tolerances. Teams that hold this line build stronger discipline than teams with 99.9% DORA green scores and an "acceptable drift" ledger culture.
3. False-positive rate on fraud / AML screening
Every payments platform screens transactions for fraud and AML compliance. The engineering metric isn't "how many frauds did we catch" — it's the ratio of true positives to false positives, and how quickly false positives are resolved.
Industry benchmarks from ACI Worldwide's 2023 Fraud Report:
| Screening type | Typical false-positive ratio | Cost of false positive |
|---|---|---|
| Card-payment fraud scoring | 5-15 false per 1 true | Customer frustration, ~$8 avg customer-service cost |
| AML transaction monitoring | 95-98 false per 1 true | Analyst review time, regulatory filing burden |
| Sanctions screening | ~99 false per 1 true | Transaction hold, customer friction |
The engineering leverage is on reducing false positives without reducing true-positive recall. Most improvements come from data-engineering investment (better merchant data, better device fingerprinting, better behavioral profiles) rather than model-sophistication. Teams that keep a monthly cross-functional review on false-positive drivers ship structurally better products than teams that treat fraud as a data-science-only project.
4. Authorization latency P99 (not P95)
For most e-commerce, P95 latency is the operative metric. In payments, P95 is not good enough — because the long tail has commercial consequences. A card authorization that takes 3 seconds usually gets abandoned by the checkout. A card authorization that takes 15 seconds gets treated as a decline by the merchant's POS and sometimes results in a duplicate charge.
| Authorization step | P99 target | P99 red flag |
|---|---|---|
| Merchant → payment gateway | < 200ms | > 500ms |
| Gateway → card scheme | < 1s | > 2s |
| Card scheme → issuing bank | < 3s | > 5s |
| Issuer decision + response | < 4s total | > 8s total |
The engineering controls are on gateway and scheme-integration layers. Issuer variance you can't control, but you measure and route against — the good gateways build issuer-performance dashboards that rank BINs (bank identification numbers) by historical response time and route traffic accordingly.
5. Change failure rate in the authorization path
A payments team with a 15% overall change failure rate sounds fine. A payments team with 15% change failure rate on the authorization path specifically is terrifying. Authorization-path CFR should be measured in basis points, not percentages:
| Change area | CFR target | CFR red flag |
|---|---|---|
| Marketing / content | 15-25% | > 40% |
| UI / non-ledger API | 10-15% | > 20% |
| Ledger / accounting | < 2% | > 5% |
| Authorization path | < 50bps (0.5%) | > 2% |
| Card scheme integration | < 20bps (0.2%) | > 1% |
The change failure rate post argues that 15% is a healthy industry average — but averages hide the segmented reality. In payments, 15% on authorization is institutional failure.
How compliance multiplies the toolchain
SoX change control for public-company banks and payment processors. Every production change affecting financial reporting must map to a ticketed request, a reviewer who is not the author, a testing record, and a rollback procedure. The engineering workflow implications are severe: branch-per-ticket discipline is mandatory, not optional. One of the first integrations customers in this vertical request in PanDev Metrics is the audit-trail export: "prove, for any deploy in the last 5 years, who wrote it, who reviewed it, what ticket authorized it, when it ran."
Deployment freeze windows that are not optional. Card-scheme release windows (quarterly for Visa/Mastercard mandates), tax-reporting deadlines, and quarter-end/year-end reconciliation all force deploy freezes. A payments engineering dashboard that doesn't overlay freeze windows on its deploy-frequency chart is producing misleading data — some periods where deploys drop are correct drops, not productivity problems.
On-prem is table stakes for core banking. Cloud-only vendors routinely lose core-banking deals because the engineering-telemetry platform itself becomes an auditable system. PanDev Metrics on-prem Docker deployment is specifically the configuration banking and core-payments customers request — the telemetry stays inside the bank's data perimeter, and auditors don't have to extend scope to a third-party SaaS.
Case pattern: typical payments/banking team
| Parameter | Core banking (tier-1 bank) | Payments processor (mid-size) | Fintech / neobank (Series B-D) |
|---|---|---|---|
| Team size | 500-5,000 engineers | 150-600 | 80-300 |
| Stack | Java + Cobol (legacy), Scala + Kotlin (new) | Go + Java, heavily event-driven | Go + TypeScript, Temporal or similar |
| DB | Oracle + DB2 (legacy), Postgres (new) | Postgres + Kafka | Postgres + Redis + event sourcing |
| Deploy cadence | Weekly on UI, monthly-quarterly on core | Daily on APIs, weekly on ledger | Daily on APIs, weekly on ledger |
| Compliance load | SoX + Basel III + local CBR/FCA | PCI-DSS Level 1 + scheme mandates | PCI-DSS + PSD2/local |
| Freeze windows / year | 6-8 quarters × 2-4 weeks | 4-6 freeze events × 1-2 weeks | 2-4 × 1 week |
The contrarian take
The most common failure pattern in payments engineering isn't slow deploys or high fraud losses — it's "paper process" culture. Teams document the change-control process thoroughly but the documentation has no relationship to what actually happened in Git. An auditor finds a deploy with no matching ticket, a reviewer who approved their own code, or a test-run record that doesn't correspond to the commit SHA deployed. Teams that automate the audit trail against their actual engineering telemetry (branch → commit → PR → deploy → ticket) are insulated; teams that rely on paper discipline are one audit away from a consent decree.
The honest limit
Our dataset has meaningful signal on about 15 payments and fintech engineering teams, primarily in CIS markets (Kazakhstan, Russia, Uzbekistan) and a few in EU. Core banking at tier-1 scale (JPMC, HSBC, Sberbank) is outside our direct observation. Benchmarks above blend our customer telemetry with published disclosures (BIS, Nilson, ACI Worldwide), regulatory filings, and interviews with payments-engineering leaders. Specific numbers — especially authorization-path CFR at the basis-point level — are directional; your own measurement inside an authorization path will produce a more precise distribution, and that distribution matters more than the industry benchmark.
Where PanDev Metrics fits
Payments and core-banking teams use PanDev Metrics primarily for the per-deploy-class segmentation described above. The IDE heartbeat data combined with Git + ticket-tracker signals produces the audit chain that SoX and scheme-compliance reviews require. The one engineering discipline this assumes is branch-naming with task IDs (feature/CORE-4821, fix/PCI-332) — most payments teams already do this because regulatory-adjacent work has been ticket-first for years. Everything else — commit-to-deploy reconstruction, reviewer-vs-author separation — is derived automatically.
Related reading
- DORA Metrics for Fintech: Proving Process Maturity to Regulators — the sibling post focused on regulator-facing DORA communication
- Engineering Metrics in Fintech: Compliance, Speed, and Security — broader fintech framing; this post is the deeper payments-specific version
- Change Failure Rate: Why 15% Is Normal and 0% Is Suspicious — the baseline CFR conversation; payments segments this table aggressively
- External: BIS Annual Economic Report 2024, Chapter on Payments — the public macro reference for global payment volumes