Why Q4 Always Blows Engineering Budget: Per-month K Seasonality

A 60-person engineering org we instrumented through 14 months of finance data ran an average overhead coefficient of K = 0.41. That number is useless. The actual monthly series is Jan 0.46, Feb 0.40, Mar 0.39, Apr 0.40, May 0.41, Jun 0.43, Jul 0.48, Aug 0.49, Sep 0.42, Oct 0.40, Nov 0.43, Dec 0.52. The flat-K finance model predicted December overhead of $185K. Reality came in at $235K. The 27% miss is not a forecasting bug. It is the entire story of every Q4 budget surprise the CFO has ever asked engineering to explain.
DORA's 2024 State of DevOps report flagged the same shape from a different angle: deployment frequency in Q4 drops 12–18% across the surveyed cohort, while incident volume rises. Stack Overflow's 2024 Developer Survey reports developers take an average of 17 vacation days per year, with concentration in late December and August. Harvard Business Review's Why Most Product Launches Fail notes Q4 launch density runs 30–40% above other quarters. Three different datasets, one consequence: engineering capacity in December is structurally different from June. Treating it as the same in your finance model is the mistake.
{/* truncate */}
What "averaged K" actually does to your forecast
The overhead coefficient K answers one question: for every dollar of direct development effort, how many extra dollars of management, meetings, ramp-up, and admin do you carry? Most engineering finance tools compute it once, average across the year, and freeze it. That works for a payroll line. It collapses for any month-by-month forecast.
Here is the simplest possible illustration. Same team, same year, two ways to predict December cost:
Direct task effort in December:        $452K
Flat K (annual average = 0.41):        × 0.41 = $185K overhead
Per-month K (December measured = 0.52): × 0.52 = $235K overhead
                                                ───────
                                       Variance: +$50K (27%)
That $50K does not appear because anyone is doing anything wrong. It appears because the denominator of K (direct task time) drops in December as vacations and holidays compress the working month, while the numerator (admin salary, kept-on retainers, end-of-year syncs) stays constant or rises. K is a ratio. Ratios swing when one side moves. Averaging the swing destroys the forecast.
For the formula and the three components of K (taskTotal, nontaskTotal, adminSalary), see Overhead Coefficient: The Hidden Tax Per Developer. This article assumes you know what K is and focuses on why it must be computed monthly.
The 14-month series, with causes
Below is the full series for the 60-engineer org. Each row is one month of (department_id, year, month) aggregation. The cause column is reconstructed from HR records, sprint logs, and the company's deploy calendar, not from guesswork.
| Month | K | Cause |
|---|---|---|
| Nov 2024 | 0.42 | Q4 launch prep, hiring lag |
| Dec 2024 | 0.50 | End-of-year crunch + holiday gaps |
| Jan 2025 | 0.46 | Returning ramp-up, OKR re-baselining |
| Feb 2025 | 0.40 | Steady state |
| Mar 2025 | 0.39 | Steady state, low overhead month |
| Apr 2025 | 0.40 | Easter, minor vacation noise |
| May 2025 | 0.41 | Steady state |
| Jun 2025 | 0.43 | Vacations begin, denominator shrinks |
| Jul 2025 | 0.48 | Peak summer vacation |
| Aug 2025 | 0.49 | Peak summer vacation continues |
| Sep 2025 | 0.42 | Return-to-work, normalization |
| Oct 2025 | 0.40 | Steady state, pre-launch focus |
| Nov 2025 | 0.43 | Q4 launch prep returns |
| Dec 2025 | 0.52 | End-of-year crunch + holidays + black-out deploys |
Look at the spread. Minimum K is 0.39 in March. Maximum is 0.52 in December. That is a 33% range within one team in one year. The yearly average smears across that range and reports 0.41 as if the year were flat. It was never flat. The CFO's January question, "why did engineering go $50K over budget in Q4?", is answered by row 14 of this table.
The shape is not unique to this client. Stack Overflow's Developer Survey has Q4 vacation concentration at roughly 22% of all annual leave taken in November and December combined. DORA's research shows deploy frequency dropping in late December for 78% of surveyed orgs. None of this is news to anyone who has worked an engineering year. It is news to the finance model because the finance model averages it away.
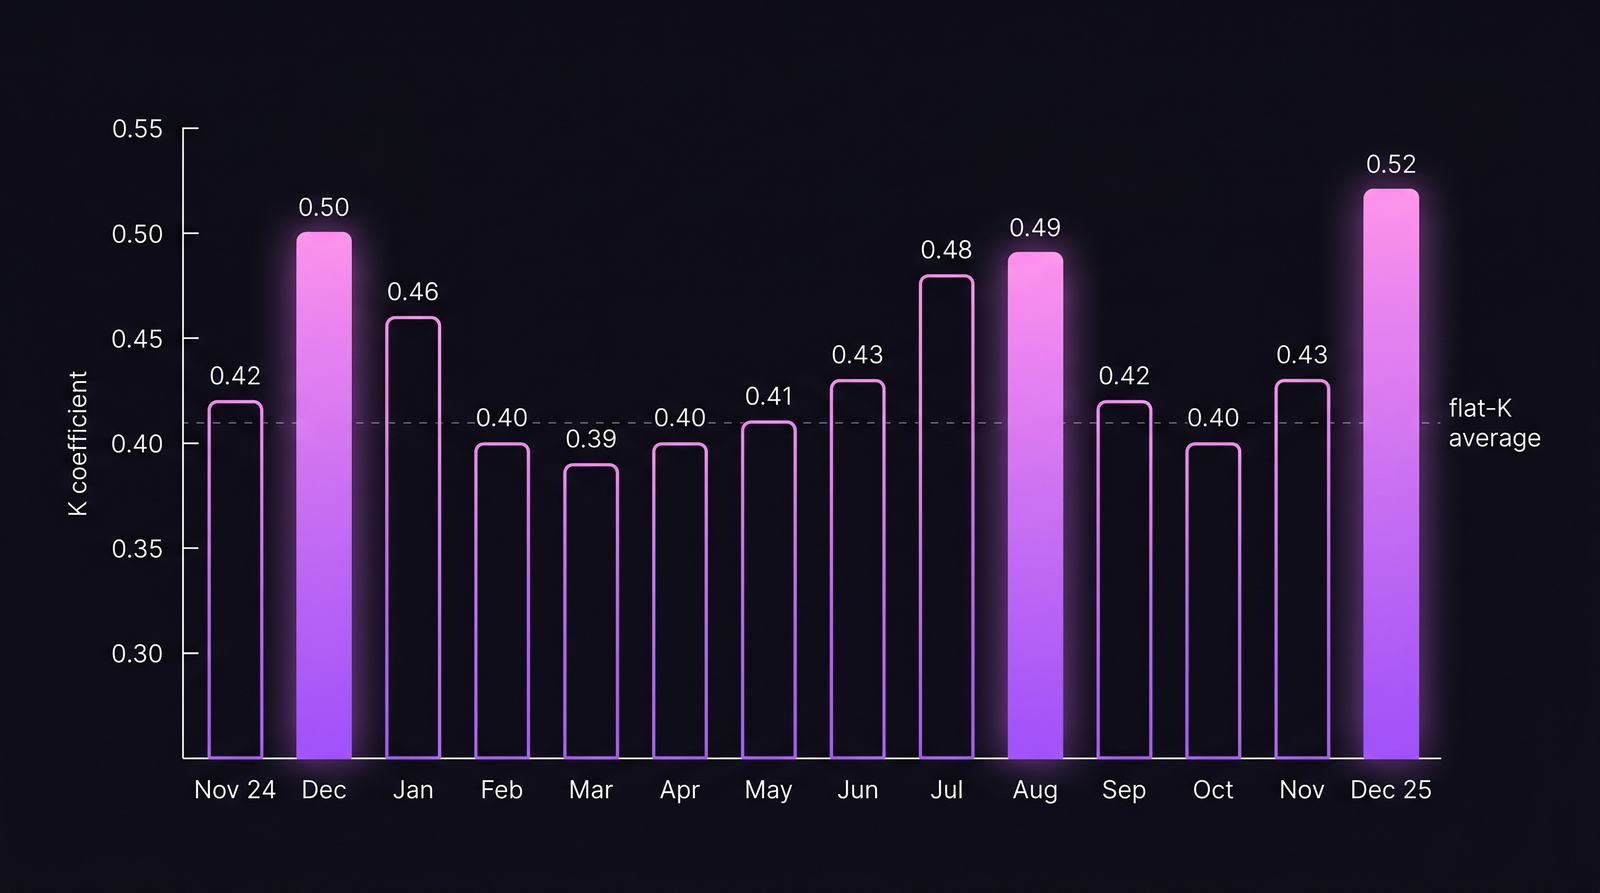 The flat-K dashed line at 0.41 is the same number every month. The bars are reality. The gap between them in December is what shows up on the CFO's variance report.
Three seasonal forces, three different mechanisms
The seasonality is not random. It is three predictable forces stacking on top of each other.
Force 1: Vacation gaps shrink the denominator. When 22% of the team is on PTO, taskTotal drops. nontaskTotal drops too, but less, because the people who are working still attend the same number of all-hands and code-review sessions. adminSalary doesn't drop at all. Your CTO is paid whether half the team is at the beach or not. The ratio K = adminSalary / (taskTotal + nontaskTotal) rises mechanically. This is why August K runs 12–18% above June K in our dataset.
Force 2: Q4 crunch raises the numerator. End-of-year launch density (HBR notes Q4 product launch volume runs 30–40% above other quarters) pulls in extra meetings, extra design syncs, extra incident response, extra leadership time. nontaskTotal rises sharply while taskTotal stays flat or even drops because of pre-holiday deploy freezes. adminSalary stays put. December K runs 18–25% above the annual baseline.
Force 3: January re-baselining is its own thing. The returning-from-holidays effect is real and measurable. Our data shows January K running 10–15% above the steady-state Feb–May months because of OKR planning, year-end retros delayed into January, hiring kickoff, and slow return of full-team cadence. People are at desks in early January but their effort skews heavily toward planning rather than direct work.
Q4 K is high because of crunch + vacation. January K is high because of re-baselining. Summer K is high because of vacation alone. These three forces do not cancel out. A finance model that knows this can budget each one separately. A flat-K model treats them as noise and gets surprised three times a year.
Side-by-side: flat-K vs per-month-K for one Q4
The CFO's variance report only cares about one comparison: what did we predict vs what did we spend. Below is the same Q4 (Oct–Dec 2025), modelled both ways.
| Month | Direct effort | Flat K (0.41) prediction | Per-month K prediction | Actual | Flat-K miss |
|---|---|---|---|---|---|
| Oct | $470K | $470K × 0.41 = $193K | $470K × 0.40 = $188K | $189K | +$4K (2%) |
| Nov | $445K | $445K × 0.41 = $182K | $445K × 0.43 = $191K | $192K | −$10K (5%) |
| Dec | $452K | $452K × 0.41 = $185K | $452K × 0.52 = $235K | $235K | −$50K (27%) |
| Q4 total | $1.367M | $560K | $614K | $616K | −$56K (10%) |
October is fine: K happened to be near the annual average. November is mildly off. December is a disaster. And the $56K Q4 miss compounds into the variance line that shows up on the CFO's quarterly report as "engineering cost overrun" with no clear cause attached. There is a clear cause. The finance model just refused to look at it.
For how a per-month K plugs into a complete bottom-up budget across multiple teams, see The CFO's Guide to Engineering Metrics. For how K combines with developer hourly rate to produce a true per-engineer loaded cost number, see Loaded Hourly Rate: The True Cost of an Engineer Hour.
How PanDev Metrics computes this without you babysitting it
The product mechanic that makes per-month K viable is the storage shape, not a clever algorithm. PanDev Metrics writes one OverheadCoefficient row per (department_id, year, month). Never aggregated, never averaged. The current month is updated every night by OverheadCoefficientCronJob, which incrementally folds yesterday's heartbeat data into the current month's K.
When something retroactive changes (an engineer's salary is corrected, a department reorg is back-dated, a tracker integration was misconfigured for two weeks), OverheadCoefficientFullRecalcCronJob rebuilds the affected months. Without that recalc job, a single HR change quietly corrupts six months of finance reports and nobody notices until the year-end audit. We learned this on our own books before we made the recalc job a hard requirement.
To pull the series for a CFO, the time-series API is POST /departments/{id}/finance/costs with granularity = MONTHLY. It returns the K trend with the same row shape as the table above. The same data feeds the Costs Chart in /dashboard/finances, which has a Year Dropdown so a finance lead can replay any historical year against the current one and see whether 2025 is tracking ahead of or behind 2024, month by month, not by yearly average.
When per-month K is wrong
Per-month K is most accurate after 12+ months of telemetry. New teams will see noisy K for the first 4–6 months as work patterns stabilize, hiring waves move through onboarding, and the team converges on its actual meeting cadence. We have seen K swing 0.30 → 0.58 in the first six months of a 12-engineer team's data, with no real underlying cost change. That's just sampling noise from low denominators.
Don't make budget decisions on the first three months of K data. Use a flat industry benchmark (0.35–0.45 is the typical B2B engineering range) until you have a year of telemetry, then switch to per-month K. The honest version of this is: per-month K is a luxury of teams that have been measuring themselves for a year. If you start measuring today, your first useful Q4 forecast is 12 months from now. There is no shortcut.
What to actually do with this in your January planning
Three concrete moves, ordered by impact.
1. Replace the flat overhead multiplier in your engineering budget spreadsheet with twelve different K values, one per month. This is a one-time migration. Pull the per-month series from your tooling, paste it into the budget template, and let December overhead get its own number. The CFO's Q4 variance line will tighten by 60–80% on the first try.
2. Stop treating January and August as forecasting outliers. They are not outliers. They are predictable peaks. Budget them at +12% and +15% respectively over the steady-state K. If you have to defend the bump to finance, point at the same Stack Overflow vacation data and DORA deploy-frequency drop they would respect from an analyst.
3. Track K by department, not just by org. Backend, frontend, and data teams have different K shapes because of different meeting loads and fixed-cost spreads. The 60-engineer org we measured had Backend K running 0.32–0.45 across the year and Data K running 0.41–0.62. A whole-org K averages those two and represents neither.
If your finance team has been chasing the Q4 surprise for three years and hasn't found it, it is not because the data is missing. The data is being averaged into invisibility. The fix is the simplest possible change to storage: don't average. Keep the months separate. The seasonality was always there.
Related reading
- Overhead Coefficient: The Hidden Tax Per Developer — the formula behind K and its three components
- Loaded Hourly Rate: The True Cost of an Engineer Hour — how K combines with rate to give the true per-hour number
- The CFO's Guide to Engineering Metrics — bottom-up budget framework for engineering finance