Performance Reviews Based on Data: Templates and Anti-Patterns

A Harvard Business Review analysis found that over 90% of managers admit their company's performance review process does not produce accurate results. In engineering, the problem is even worse: managers write vague paragraphs based on what they remember from the last two weeks. High performers who are quiet get overlooked. Loud underperformers get rated higher than they should. And everyone walks away feeling like the process was arbitrary. Data fixes this — but only if you use it correctly.
{/* truncate */}
The Problem With Traditional Engineering Reviews
Let's name the biases that poison most review cycles:
| Bias | What Happens | Example |
|---|---|---|
| Recency bias | Only recent work is evaluated | A developer who shipped a major feature in Q1 but had a slow Q3 gets rated "needs improvement" |
| Availability bias | Visible work counts more | The developer who presents in all-hands gets rated higher than the one who quietly fixes critical infrastructure |
| Halo effect | One trait colors everything | "She's a great communicator" becomes "she's great at everything" |
| Similarity bias | People like managers get rated higher | Extroverted developers get better reviews from extroverted managers |
| Anchoring | Last year's rating persists | "He was a 3 last year, so he's probably a 3 this year" |
Data doesn't eliminate bias — humans still interpret data — but it creates an objective foundation that's much harder to ignore or distort. This is consistent with research from the Accelerate program (Forsgren, Humble, Kim), which found that data-informed management practices correlate with both higher team performance and stronger organizational culture.
What Data to Collect for Reviews
A solid engineering review should draw from multiple data sources. No single metric tells the whole story.
Quantitative Data (from your engineering platform)
| Data Point | Time Range | Purpose |
|---|---|---|
| Activity Time trend | Full review period | Baseline work patterns |
| Focus Time average | Full review period | Deep work capacity and environment quality |
| Delivery Index | Full review period | Consistency of delivery against commitments |
| PR cycle time | Full review period | Workflow efficiency |
| Code review participation | Full review period | Team contribution beyond own code |
| Project allocation | Full review period | Scope and complexity of work |
| Cost per project | Full review period | Business impact context |
Qualitative Data (from humans)
| Source | Method | Purpose |
|---|---|---|
| Peer feedback | 360 survey or direct conversations | Collaboration, mentorship, influence |
| Self-assessment | Written reflection | Developer's own perspective on impact |
| PM/Design feedback | Cross-functional input | Communication, reliability, partnership |
| Customer impact | Incident reports, feature adoption | Business outcomes |
| Manager observations | 1:1 notes over the period | Growth, challenges, context |
The formula is simple: quantitative data shows what happened; qualitative data explains why it matters.
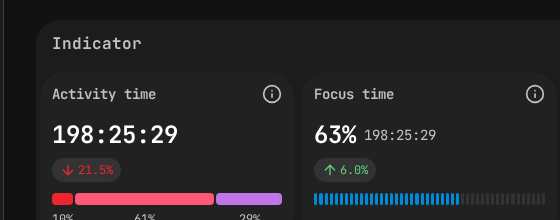 PanDev Metrics employee view — Activity Time (198h) and Focus Time (63%) provide objective data points for fair performance evaluations.
The Data-Driven Review Template
Here's a complete template for writing an engineering performance review backed by data.
Section 1: Summary & Rating
Developer: [Name]
Role: [Current title]
Review Period: [Q1-Q2 2026 / Annual 2025-2026]
Manager: [Your name]
Overall Rating: [Exceeds / Meets / Below Expectations]

One-paragraph summary:
[2-3 sentences capturing the developer's overall performance,
key accomplishments, and growth trajectory. This should be
defensible with the data below.]
Section 2: Delivery & Impact
Key Metrics (review period):
- Delivery Index: [X] (team avg: [Y])
- Projects completed: [list]
- Estimated business impact: [revenue, cost savings, risk reduction]

Highlights:
- [Specific accomplishment #1 with data]
- [Specific accomplishment #2 with data]
- [Specific accomplishment #3 with data]

Example:
"Led the payment processing migration (Project Falcon) from
legacy system to Stripe. Delivery Index of 0.92 for the project
against a team average of 0.78. The migration reduced payment
processing costs by 34% ($180K annual savings) and cut
checkout errors by 60%."
Section 3: Technical Growth
Key Metrics:
- PR cycle time trend: [improving / stable / declining]
- Code review quality: [peer feedback summary]
- Technical scope: [types of projects and complexity]

Assessment:
- [Technical skill area #1]: [Evidence-based assessment]
- [Technical skill area #2]: [Evidence-based assessment]
- [Architecture/design contributions]: [Specific examples]

Example:
"PR cycle time improved from 8 hours to 3.5 hours average over
the review period, reflecting better PR sizing and clearer
descriptions. Peer feedback consistently mentions thorough,
constructive code reviews — reviewed 156 PRs across 4 teams."
Section 4: Collaboration & Leadership
Key Metrics:
- Cross-team review activity: [X reviews outside own team]
- Mentoring: [evidence from 1:1s, peer feedback]
- Knowledge sharing: [docs, tech talks, pair programming]

Assessment:
[Narrative based on peer feedback and observable behaviors]

Example:
"Mentored two junior developers through their onboarding.
Both ramped to independent contribution within 6 weeks
(team average: 10 weeks). Peer feedback highlights patience
and clarity in code review comments."
Section 5: Areas for Growth
Based on data and feedback, focus areas for next period:

1. [Area #1]: [Specific, evidence-based observation]
   Action plan: [Concrete steps]

2. [Area #2]: [Specific, evidence-based observation]
   Action plan: [Concrete steps]

Example:
"Focus Time averaged 1.2 hours/day vs. team average of 2.8
hours. Investigation shows high meeting load (12 recurring
meetings/week) and frequent context switching between 4
concurrent projects. Action plan: Reduce recurring meetings
to 6, limit concurrent projects to 2, establish Wednesday
as a no-meeting deep work day."
Section 6: Goals for Next Period
Goal 1: [SMART goal tied to growth area]
Measurable by: [Specific metric or milestone]

Goal 2: [SMART goal tied to career progression]
Measurable by: [Specific metric or milestone]

Goal 3: [SMART goal tied to team/org impact]
Measurable by: [Specific metric or milestone]
The Calibration Process
Writing individual reviews is only half the battle. Calibration — the process of ensuring consistency across managers and teams — is where data becomes essential.
Pre-Calibration Data Pack
Before the calibration meeting, every manager should prepare:
| Element | Details |
|---|---|
| Rating distribution | Proposed ratings for their team |
| Metrics summary | Key metrics for each team member (anonymized for initial discussion if needed) |
| Outlier justification | For anyone rated "Exceeds" or "Below" — specific data supporting the rating |
| Cross-team comparison | How team metrics compare to org averages |
Calibration Meeting Framework
Step 1: Present distributions (15 min) Each manager shares their proposed rating distribution. Look for statistical red flags:
- Is one manager rating everyone "Exceeds"? (Leniency bias)
- Is another manager's team all "Meets"? (Central tendency bias)
- Do distributions roughly follow expected patterns?
Step 2: Review outliers (30 min) Focus on "Exceeds Expectations" and "Below Expectations" ratings. For each:
- Manager presents the data case
- Other managers challenge with questions
- Group decides if the rating is calibrated
Step 3: Cross-team consistency (15 min) Compare developers with similar ratings across teams:
- Does a "Meets" in Team A look like a "Meets" in Team B?
- Are the bar and expectations consistent?
Step 4: Finalize (10 min) Lock ratings, note any follow-up actions.
The Data Calibration Grid
Use this grid to spot miscalibrations quickly:
| Developer | Delivery Index | Focus Time | PR Cycle Time | Peer Score | Proposed Rating |
|---|---|---|---|---|---|
| Dev A | 0.91 | 3.1 hrs | 3.2 hrs | 4.5/5 | Exceeds |
| Dev B | 0.85 | 2.8 hrs | 4.1 hrs | 4.2/5 | Meets |
| Dev C | 0.88 | 2.9 hrs | 3.0 hrs | 4.4/5 | Meets |
| Dev D | 0.62 | 1.1 hrs | 12.3 hrs | 3.1/5 | Below |
In this example, Dev C's data looks comparable to Dev A's — the calibration group should ask why the ratings differ. Maybe there's a valid qualitative reason. Maybe there's a bias at play.
Anti-Patterns That Destroy Trust
Anti-Pattern 1: The Metrics-Only Review
What it looks like: "Your Activity Time was 2.1 hours/day. Team average is 2.8. Rating: Below Expectations."
Why it fails: No context. The developer might have been doing architecture work, mentoring juniors, handling incidents, or dealing with a personal situation. Metrics without narrative are accusations.
Fix: Every metric cited must be accompanied by a question or conversation. If you didn't discuss it in a 1:1 first, it doesn't belong in the review.
Anti-Pattern 2: The Surprise Review
What it looks like: The developer learns about performance issues for the first time during the review.
Why it fails: It's too late to course-correct. The developer feels ambushed and the trust is broken permanently.
Fix: If data shows a concerning trend, address it in 1:1s immediately. By review time, there should be zero surprises.
Anti-Pattern 3: The Stack Rank
What it looks like: Forcing a normal distribution. "We need exactly 10% Exceeds, 70% Meets, 20% Below."
Why it fails: If you hired well, most people should be meeting expectations. Forcing a curve means you're lying about someone's performance — either inflating or deflating — to hit a quota.
Fix: Rate against expectations for the role, not against each other. Use calibration to ensure consistency, not to force distribution.
Anti-Pattern 4: The Copy-Paste
What it looks like: "Continues to be a strong contributor. Meets expectations across all areas." — identical to last quarter.
Why it fails: It tells the developer you didn't pay attention. It provides no growth guidance. It's demoralizing.
Fix: Reference specific data from the review period. Cite project names, metric changes, and concrete examples. If you can't, you didn't observe enough during the period.
Anti-Pattern 5: The Moving Goalpost
What it looks like: "You shipped everything we asked for, but we expected you to also take on more leadership."
Why it fails: You can't evaluate someone against criteria you never communicated.
Fix: Set explicit expectations at the start of each review period. Write them down. Review them at mid-point. Evaluate against them — and only them — at the end.
The Review Delivery Conversation
Having good data and a well-written review is necessary but not sufficient. How you deliver it matters enormously.
Before the Meeting
- Share a self-assessment form at least a week before the review
- Read the developer's self-assessment carefully before writing your final review
- Prepare for disagreements — know which data points support your assessment
During the Meeting
- Start with their self-assessment (5 min): "How do you feel about your performance this period?"
- Share the overall rating (2 min): Don't bury the lede. Say the rating early.
- Walk through evidence (15 min): Go section by section through the review, referencing data
- Discuss growth areas (10 min): Frame as investment, not criticism
- Set goals together (10 min): Collaborative, not dictated
- Q&A (remaining time): Let them ask anything
After the Meeting
- Share the written review document within 24 hours
- Schedule a follow-up 1:1 within a week (they'll have questions after processing)
- Track progress on growth goals in regular 1:1s
Building a Review-Ready Data Culture
If you want data-driven reviews to work, you need to build the infrastructure before review season:
Ongoing (not just at review time):
- Track engineering metrics continuously — don't try to reconstruct 6 months of data retroactively
- Use 1:1s to discuss data regularly so it's normalized, not surprising
- Collect peer feedback throughout the cycle, not just in a last-minute 360
Per-cycle prep timeline:
| When | Action |
|---|---|
| Period start | Set expectations and measurable goals with each developer |
| Monthly | Quick data check per developer; course-correct in 1:1s |
| Mid-cycle | Formal mid-point check-in with data review |
| Pre-review (2 weeks) | Pull full-period metrics; collect peer feedback |
| Pre-review (1 week) | Distribute self-assessment forms |
| Review week | Write reviews; hold calibration; deliver |
| Post-review (1 week) | Follow-up conversations; set next-period goals |
A Fair Review Starts With Fair Data
The entire framework above rests on one assumption: that your data is comprehensive and fair. This means:
- Measuring outcomes, not just outputs — delivery impact, not just lines of code
- Accounting for invisible work — code reviews, mentoring, incident response, documentation
- Recognizing role differences — a staff engineer's metrics will look different from a junior developer's
- Transparency — developers should be able to see the same data you're using to evaluate them
The last point is critical. When developers have access to their own dashboards and can track their own metrics, the review becomes a conversation between two people looking at the same data — not a judgment handed down from above. As Will Larson argues in An Elegant Puzzle, the best review systems are ones where the outcome is already known to both parties before the meeting begins — because the data has been shared and discussed all along.
Build a review process your engineers actually trust. PanDev Metrics provides per-developer dashboards with Activity Time, Focus Time, Delivery Index, and cost analytics — visible to both managers and developers. Export to Excel or PDF for review documentation. Start collecting the data now so your next review cycle is backed by evidence, not memory.