Retail Engineering: Online + Brick-and-Mortar Metrics

An engineering director at a 400-store regional retailer put it cleanly: "Every time we ship a feature that makes the website faster, we hear applause from marketing. Every time we ship a feature that lets a store associate do their job in half the clicks, we hear silence — and then the quarterly numbers move." Retail engineering is the discipline of serving two populations (shoppers and store associates) and two physical realities (the warehouse and the store floor) from the same codebase.
McKinsey's 2024 State of Retail report found that 73% of shoppers used multiple channels for a single purchase journey — browse mobile, try in-store, buy online, return curbside. Every one of those transitions is an engineering surface: the product-detail page has to know store availability, the BOPIS (buy online, pickup in store) flow has to reserve inventory atomically, the returns kiosk has to un-reserve it. A 2023 IHL Group study documented $1.75 trillion in global retail out-of-stock losses — many of which trace back to inventory-service latency or sync failures, not physical stockouts.
{/* truncate */}
Why retail engineering is different
Three realities pull retail engineering away from pure e-commerce:
Inventory is a shared mutable resource with physical consequences. When an online shopper and a store associate both claim the last unit of a SKU, you can't just "retry and reconcile." Someone physically picks up a box that isn't there. Inventory engineering is the hardest part of retail tech, and it gets harder every time you add a fulfillment channel.
POS systems run on different clocks than the web. Most point-of-sale systems in production today were installed 8-15 years ago, run on Windows Embedded POSReady or similar, and sync to the central inventory service in batches — sometimes hourly, sometimes nightly. "Real-time inventory" is a marketing slogan more often than a technical reality. The engineering team that tries to force synchronous inventory updates across legacy POS ends up with merged deploys that don't actually deploy.
Holiday seasonality dwarfs SaaS load curves. Black Friday / Cyber Monday / 11.11 produce traffic spikes of 5-20× baseline on the digital side and in-store transaction volume 3-5× on the physical side. A deploy that works under October load can fail catastrophically under Black Friday load, and the store-associate UI — running on old hardware — can brown-out 10 minutes before the web tier does.
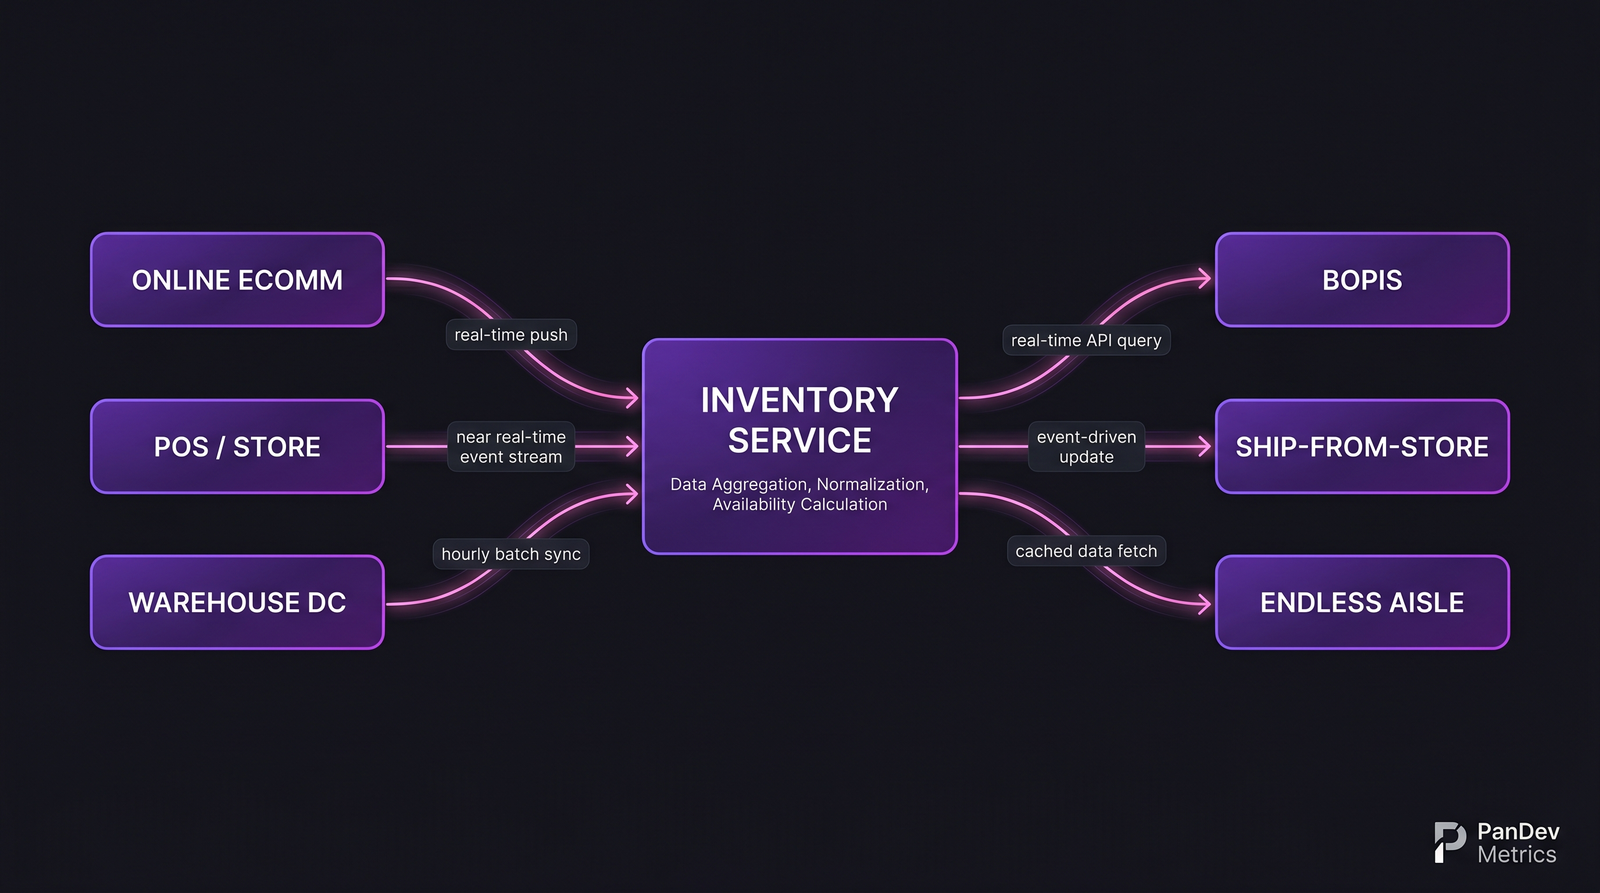 The inventory service is the keystone. Every omnichannel feature depends on it, and every feature shipped without considering its impact on inventory freshness creates debt that compounds through the next peak season.
The 5 metrics that matter
1. Inventory-sync freshness (per channel)
The single most important retail-engineering metric is the age of the inventory number a customer sees when making a decision. A product page showing "3 available at Store #412" that's 90 minutes stale will misfire on ~10% of BOPIS reservations during busy hours.
| Channel | Target freshness | Red-flag ceiling |
|---|---|---|
| Online product page (home delivery) | < 5min | > 30min |
| Online product page (store pickup) | < 2min | > 10min |
| Store associate app (customer-facing) | < 1min | > 5min |
| Warehouse / DC picking tool | < 30s | > 2min |
| Endless-aisle kiosk | < 2min | > 10min |
Most retail-engineering teams report a single "inventory freshness" number to leadership. The interesting signal is in the spread across channels — a tight spread means the sync pipeline is healthy; a wide spread means different paths have different failure modes and one of them is lying to customers.
2. BOPIS reservation success rate
BOPIS is the omnichannel feature with the most engineering leverage. When it works, it converts a browser into a buyer at checkout; when it fails, it tells the customer "we made a mistake, please drive to the store and not get what you came for."
The metric: of all BOPIS orders placed, what percentage result in a customer picking up the specific item at the specific store within the promised window, without manual store-associate intervention?
| BOPIS health tier | Reservation success rate | What fails |
|---|---|---|
| Best-in-class | > 96% | Random store issues (broken box, damaged item) |
| Industry healthy | 90-95% | Occasional inventory-sync misfires, store-associate search friction |
| Underperforming | 80-90% | Systemic inventory-freshness gaps, mispicks |
| Broken | < 80% | Fulfillment pipeline is functionally random |
Getting from 85% to 95% is usually a 6-12 month engineering project involving inventory reservation holds (not just counts), store-associate UI for surfacing held items, and exception workflows for common failure modes. The ROI is massive and slow — customer-retention effects show up 12-18 months after the project lands.
3. POS deploy reach
How many POS terminals successfully received and activated the last deploy? This is a metric most web-focused engineering teams don't even have a dashboard for, because POS deploys typically go through an entirely separate release process owned by a "store systems" team that doesn't report to the CTO.
| POS footprint | Deploy reach after 1 week | Deploy reach after 4 weeks |
|---|---|---|
| Cloud-POS (modern SaaS) | > 98% | > 99.5% |
| Hybrid cloud/local | 90-95% | > 97% |
| Legacy thick-client | 70-85% | 90-95% |
| Air-gapped stores (rural / shoplifting-high) | 50-70% | 80-90% |
If your POS deploy reach is 85% after a week, and you shipped an inventory-sync fix in that deploy, then 15% of your stores are still running the old bug. The "we fixed it" engineering narrative is wrong for those customers. Measuring this explicitly changes how engineering and merchandising coordinate on incident postmortems.
4. Return-to-inventory cycle time
Returns are the quiet engineering problem. A returned item doesn't re-enter inventory until some combination of store-associate inspection, warehouse receipt, quality check, and system update. The cycle time matters because items in return purgatory are not available to sell.
| Return channel | Typical cycle time | Good cycle time |
|---|---|---|
| In-store return (same SKU) | 1-4 hours | < 30min |
| In-store return (wrong SKU / investigation) | 1-3 days | < 4 hours |
| Mail-in return | 5-10 business days | 2-3 business days |
| Third-party return (kiosk, carrier pickup) | 7-14 business days | 3-5 business days |
Apparel retailers with 30-40% return rates live or die on this metric. A 2-day improvement in return cycle time on a fast-turn SKU can be worth single-digit percentages of revenue through re-sell velocity — engineering investment that merchandising teams rarely fund because it doesn't show up on their dashboards.
5. Store-associate workflow friction
The most under-instrumented retail-engineering metric is how long common workflows take store associates. Measuring "how many seconds to look up inventory for customer X" across 400 stores is harder than measuring web-page load time, but it's the metric that decides whether associates trust the tool or route around it.
Typical workflow targets for a handheld store-associate device (Zebra, Honeywell, or iPhone-based):
| Workflow | Target time | Industry median |
|---|---|---|
| SKU lookup (scan or search) | < 3s | 4-7s |
| Check other-store availability | < 5s | 8-15s |
| Initiate ship-from-store order | < 30s | 45-90s |
| Process BOPIS handoff | < 45s | 60-120s |
| Process return (same SKU, in-policy) | < 60s | 90-150s |
Our developer experience post argues that internal-tool latency compounds into engagement problems over weeks. The equivalent for retail is store-associate tooling latency: slow tools produce associates who avoid the tool, which produces lost sales and lost inventory-integrity signals.
How scale and regulation reshape the toolchain
Multi-geography compliance. Retailers operating across borders hit data-residency walls fast. Kazakhstan's data-localization law, Russia's 152-FZ, GDPR, CCPA, and Brazil's LGPD all require different decisions about where inventory, customer, and transaction data lives. The engineering-metrics platform has to follow the same rules. Our on-prem deployment is the configuration retail customers request when their multi-country footprint pushes them past SaaS-metrics feasibility.
Payment-card scope reduction. PCI-DSS applies to every retailer that takes cards, and the engineering investment to keep PCI scope contained is ongoing. Omnichannel features that cross the payment boundary (save-a-card-in-store-for-online-use) routinely blow PCI scope unless designed with tokenization from day one.
Labor law on store-associate software. In jurisdictions with strict working-time regulations (EU, Kazakhstan, Russia), any software that tracks associate activity becomes a labor-law artifact. This shapes what you can measure about associate workflows and how you can use the data. Engineering teams that ignore this end up with features they have to un-ship after the next works-council review.
Case pattern: typical retail engineering team
| Parameter | Typical range (2026) |
|---|---|
| Team size | 150-2,000 engineers across digital + store systems |
| Digital engineering | 50-60% of total |
| Store systems / POS | 15-25% |
| Supply chain / warehouse | 15-25% |
| Data / ML (personalization, forecasting) | 10-15% |
| Stack (digital) | Java/Kotlin backends, React/Next.js frontend, Elasticsearch for product search |
| Stack (POS) | Windows Embedded / Android kiosks, C# or Kotlin, local SQL + sync |
| Deploy cadence (digital) | Daily outside freeze; weekly in freeze window |
| Deploy cadence (POS) | Weekly to monthly, staged across store cohorts |
| Freeze window | Late October to early January (holiday code-freeze) |
The contrarian take
Most retail-engineering roadmaps treat store-associate tooling as a cost center and digital as a revenue driver. The data suggests the opposite: engineering investment in associate-facing workflows (BOPIS handoff UX, cross-store availability lookup, endless-aisle ordering) produces top-line revenue lift faster and more reliably than equivalent investment in the digital storefront. The digital storefront is already optimized past the point of diminishing returns; the store-associate UI is usually optimized back to 2012. Retailers who rebalance their engineering portfolio toward associate tooling compound a structural advantage that's hard to replicate through marketing.
The honest limit
Our engineering-telemetry dataset has direct visibility into ~20 retail and e-commerce teams, predominantly in CIS markets (including large Kazakhstan retailers and several Russian marketplaces) plus a handful of EU mid-size retailers. We don't have direct telemetry on the largest global retailers (Walmart, Amazon, Costco, Carrefour). Benchmarks for POS deploy reach and inventory-sync freshness above draw on published engineering blogs, retail-technology industry reports (NRF, RSR Research, IHL Group), and interviews with retail-engineering leaders. Teams operating at 5,000+ stores will see meaningfully different distributions, especially on POS deploy reach and legacy-system sync latency.
Where PanDev Metrics fits
Retail engineering teams at 150+ engineers typically have the cross-team coordination problem that aggregate DORA hides: digital is shipping fast, POS is shipping slow, warehouse is shipping with a different release train. PanDev Metrics produces per-repository / per-team breakdowns from the same IDE heartbeat data, so the CTO dashboard shows whether POS and digital are drifting further apart or converging. The AI assistant handles queries like "which stores are on the latest POS build?" when the relevant data is in the deployment signals we already capture.
Related reading
- E-Commerce: How to Accelerate Feature Delivery Before High Season — the digital-side playbook for holiday peaks, prerequisite reading for omnichannel peak planning
- Marketplace Platform Engineering: Metrics for Two-Sided Products — adjacent two-sided dynamics that retail aggregators (Wildberries, Ozon) share
- Change Failure Rate: Why 15% Is Normal and 0% Is Suspicious — the CFR baseline; retail segments aggressively by channel
- External: NRF State of Retail Technology 2024 — the industry reference on omnichannel engineering trends