SaaS Startup: Engineering Metrics From Seed to Series B

At seed stage, your CTO writes code and ships features. By Series B, you have 40 engineers across multiple teams, and the CTO hasn't pushed a commit in months. The engineering metrics that matter at each stage are completely different — and getting them wrong can mean building the wrong things, hiring the wrong way, or telling investors a story that doesn't match reality. The T2D3 framework (Triple, Triple, Double, Double, Double) that defines SaaS growth expectations demands engineering velocity that scales with revenue ambitions.
Here's how to evolve your engineering metrics as your SaaS startup grows.
{/* truncate */}
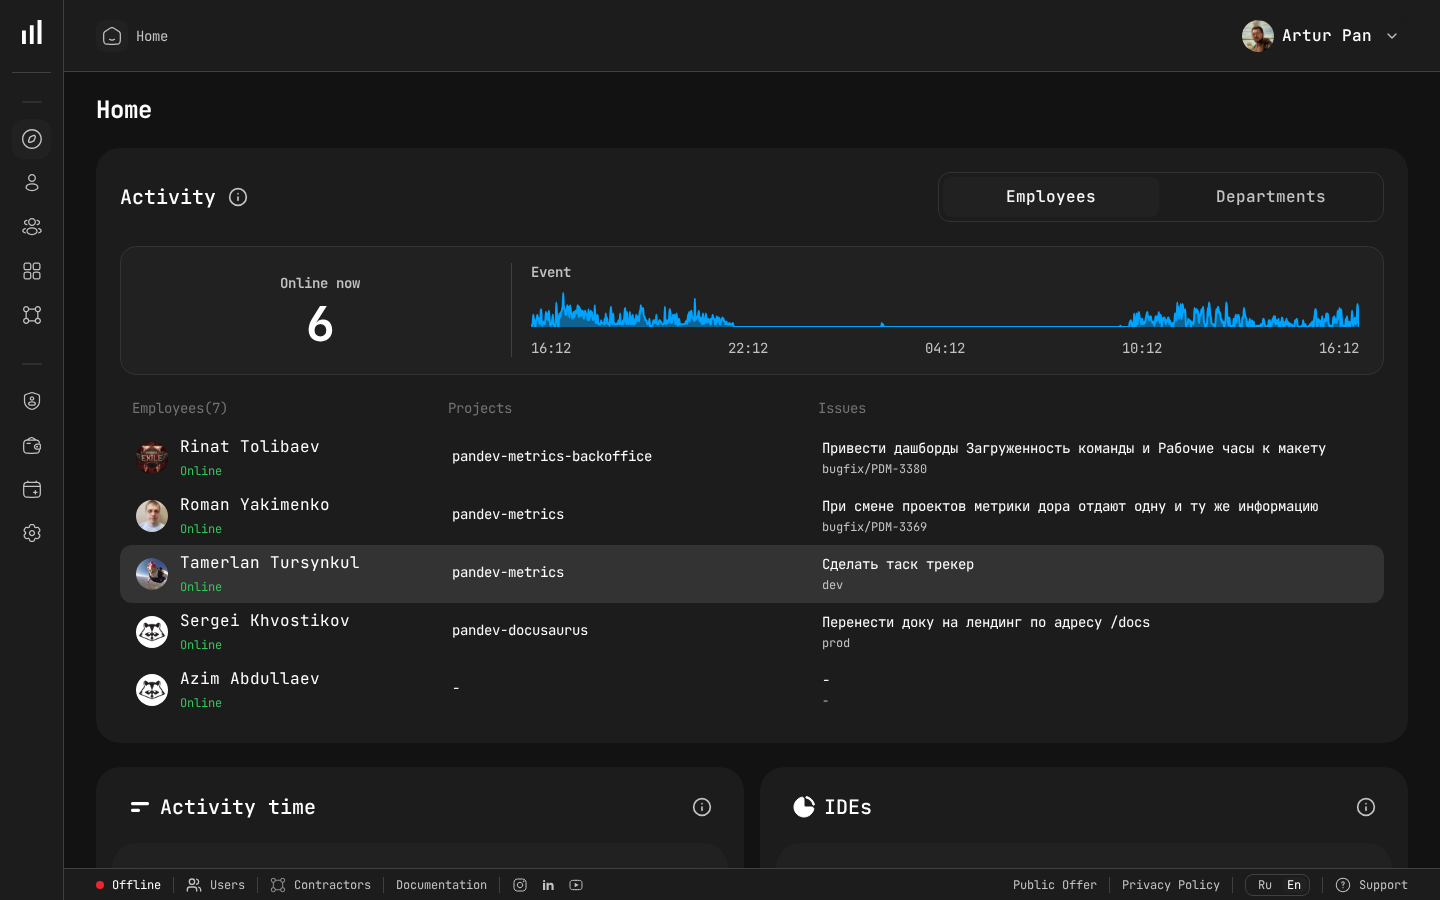
Team dashboard showing the engineering metrics investors want to see.
Why Startups Need Engineering Metrics (Earlier Than You Think)
Most startup CTOs dismiss engineering metrics as "enterprise overhead." When you have 3 engineers sitting next to each other, you can see everything. You know who's shipping, what's blocked, and where the problems are.
But this breaks down faster than you expect:
- At 5 engineers: You can no longer observe everyone's work directly
- At 10 engineers: You start missing things — blocked PRs, duplicated work, mounting technical debt
- At 20 engineers: You're making hiring and resource allocation decisions based on incomplete information
- At 40+ engineers: You're flying blind, relying on team leads who may or may not have the full picture
The best time to establish engineering metrics is before you need them. Starting early means you have historical data when it matters — for fundraising, for scaling decisions, and for identifying problems before they become crises.
Seed Stage (2-5 Engineers): Focus on Flow
At seed stage, your only job is to find product-market fit as fast as possible. Your engineering metrics should reflect this singular focus.
Metrics That Matter
Deployment Frequency: How often are you shipping to customers? At seed stage, you should be deploying multiple times per day. If you're not, something is wrong — your deployment pipeline is too manual, your PRs are too large, or your testing process is too slow.
Lead Time for Changes: From the moment a developer starts coding to the moment the feature is in production. At seed, this should be hours, not days. Track this to ensure your development process stays lean.
Cycle Time per Feature: How long does it take to go from "we decided to build this" to "customers are using it"? This is your speed of learning, and it's the most important thing at seed stage.
What to Skip
Don't track individual developer activity metrics. Don't set up elaborate dashboards. Don't measure test coverage. At seed stage, overhead is the enemy.
Implementation
PanDev Metrics' IDE plugins are lightweight enough for a seed-stage team. Install them, connect your Git platform, and you'll have deployment frequency and lead time data with near-zero setup overhead. This costs you nothing today and gives you valuable historical data later.
Post-Seed to Series A (5-15 Engineers): Build the Foundation
You've found initial product-market fit and raised your Series A (or you're preparing to). The team is growing, and the CTO is transitioning from individual contributor to manager.
Metrics That Matter
Everything from Seed, plus:
Change Failure Rate: As the team grows and moves faster, quality can slip. Track how often deployments cause issues — rollbacks, hotfixes, or incidents. If change failure rate is creeping up, it's a signal that your testing practices or review processes need to evolve.
Developer Focus Time: With a growing team comes more meetings — standups, sprint planning, design reviews, one-on-ones. PanDev Metrics' IDE heartbeat tracking shows you how much uninterrupted coding time developers actually get. If your 10-person team averages less than 2 hours of Focus Time per day, you have a meeting culture problem.
Activity Distribution: Where is engineering time going? At this stage, you need visibility into the split between:
- New feature development
- Bug fixes and maintenance
- Infrastructure and tooling
- Technical debt remediation
If 50% of your time is going to bug fixes and maintenance, that's a signal that you took on too much technical debt during the seed stage. Better to know now than to discover it when you're trying to double the team.
The Series A Investor Story
When fundraising for Series A, investors want to see:
- You can ship fast. Deployment frequency and lead time demonstrate this.
- Quality is maintained. Change failure rate shows you're not sacrificing stability for speed.
- The team is productive. Focus Time and activity distribution show your engineers are actually building, not drowning in process.
- You have a foundation for scaling. Having metrics infrastructure in place signals engineering maturity.
These aren't just vanity metrics for a pitch deck. They're evidence that your engineering organization can scale with the business. SaaStr benchmarks show that Series A investors increasingly evaluate engineering velocity alongside ARR growth — companies that can demonstrate both win higher valuations.
Implementation
At this stage, you should have:
- PanDev Metrics connected to your Git platform and project tracker (Jira or ClickUp)
- IDE plugins deployed to all developers
- A weekly review of key metrics with your engineering leads
- Basic dashboards showing deployment frequency, lead time, and change failure rate trends
Series A to Series B (15-40 Engineers): Scale With Confidence
This is where most startups hit their first engineering scaling crisis. The team has doubled or tripled, you're splitting into multiple squads, and the coordination overhead is growing exponentially.
Metrics That Matter
Everything from before, plus:
DORA Metrics by Team: You now have multiple teams, and they'll perform differently. Comparing DORA metrics across teams helps you identify which teams need support and which practices should be shared.
But be careful: different teams have different contexts. The team maintaining your core payment infrastructure should have a lower deployment frequency and longer lead times than the team building a new dashboard feature. Context matters.
Mean Time to Recovery (MTTR): With more engineers deploying more frequently, incidents will happen. MTTR measures how quickly you recover. Track it by service to identify which parts of your system are fragile.
Financial Analytics: At this stage, engineering is likely your largest cost center. PanDev Metrics' financial analytics help you understand:
- Cost per feature or project
- Engineering cost trends as you scale
- Resource allocation efficiency across teams
- Whether hiring is translating into proportional output increase
Cross-Team Dependencies: As teams multiply, dependencies become the biggest source of delays. Track lead time for changes that require coordination across teams versus those that don't. If cross-team work takes 3x longer, you may need to restructure team boundaries.
The Series B Investor Story
Series B investors are evaluating your ability to scale efficiently. They want to see:
- Engineering output scales with headcount. If you doubled the team but deployment frequency stayed flat, something is wrong.
- Quality doesn't degrade with growth. Change failure rate should be stable or improving despite more engineers shipping more code.
- You understand your unit economics. Financial analytics showing cost per feature and engineering ROI demonstrate business sophistication.
- You can manage complexity. DORA metrics by team, cross-team dependency tracking, and MTTR trends show you have a handle on organizational complexity.
The Scaling Trap: Adding Engineers Without Adding Output
The most common pattern we see at this stage: the team grows from 15 to 35, but delivery speed feels the same or slower. Sprint velocity per developer drops. Features take longer. The board asks uncomfortable questions. The Bessemer Cloud Index confirms this pattern — engineering efficiency (measured as revenue per engineer) typically dips ~20-30% during rapid scaling before stabilizing.
Engineering metrics illuminate what's happening:
- Focus Time per developer drops as coordination overhead increases
- Lead time increases because review queues get longer and deployment pipelines become contested
- Activity distribution shifts toward maintenance and coordination, away from new development
- Deployment frequency per team may increase while overall feature delivery slows because each feature requires more cross-team coordination
Without metrics, the default response is "we need to hire more engineers." With metrics, you can identify the actual bottleneck — often it's organizational structure, not headcount.
Implementation
At 15-40 engineers, your metrics infrastructure should include:
- PanDev Metrics with full DORA metrics tracking
- IDE plugins across all teams (PanDev supports 10+ IDEs)
- Integration with both your Git platform and project tracker
- Team-level dashboards with weekly review cadence
- Financial analytics for engineering cost visibility
- LDAP/SSO integration for seamless team management
If you're managing sensitive customer data, PanDev Metrics supports on-premise deployment — your engineering data stays within your infrastructure.
Common Mistakes at Each Stage
Seed Stage Mistakes
- Over-investing in metrics infrastructure. Keep it simple. Plugin + Git integration. Nothing more.
- Tracking vanity metrics. Lines of code, number of commits, hours logged — none of these tell you anything useful.
- Ignoring deployment frequency. If you're not deploying daily at seed stage, fix your pipeline before worrying about anything else.
Series A Stage Mistakes
- Using metrics to compare individual developers. This destroys trust and drives gaming behavior. Keep metrics at the team level.
- Setting targets without baselines. Measure first, improve second. Your baseline is your baseline — comparing to DORA industry benchmarks is misleading because context varies enormously.
- Ignoring Focus Time. The meeting tax is the biggest hidden cost in growing engineering organizations. Measure it.
Series B Stage Mistakes
- Optimizing team metrics without considering system-level impact. Each team can have great DORA metrics while the overall system is getting worse due to integration complexity.
- Attributing problems to engineers instead of systems. If one team is slower, the cause is almost always structural (dependencies, legacy code, unclear requirements), not individual performance.
- Delaying financial analytics. By Series B, the board expects engineering cost visibility. Building this retroactively is painful.
The Metrics Maturity Roadmap
| Stage | Team Size | Key Metrics | Review Cadence |
|---|---|---|---|
| Seed | 2-5 | Deployment frequency, lead time | Weekly glance |
| Post-Seed | 5-10 | + Change failure rate, Focus Time | Weekly review |
| Series A | 10-20 | + Activity distribution, MTTR | Weekly team reviews |
| Pre-Series B | 20-35 | + Financial analytics, cross-team metrics | Weekly + monthly leadership review |
| Series B+ | 35-50+ | Full DORA by team, multi-tenancy, department-level views | Weekly team + monthly exec dashboard |
Forbes Kazakhstan reports that ~40 companies are currently piloting engineering intelligence platforms, with early results showing "a 30% productivity increase, while release quality improves by 25%." — Forbes Kazakhstan, April 2026
Starting Today
Regardless of your stage, the first step is the same:
- Connect your Git platform to PanDev Metrics
- Deploy IDE plugins to your team
- Wait 2-4 weeks for baseline data
- Review what you see and identify your biggest bottleneck
- Improve one thing at a time
The startups that build metrics infrastructure early don't just operate better — they tell a more compelling story to investors, make better hiring decisions, and identify problems before they become existential.
Building a SaaS startup and want engineering metrics that grow with you? PanDev Metrics — from two engineers in a garage to 200+ across multiple teams.