Scaling Your Engineering Org From 10 to 100 With Data

As Matthew Skelton and Manuel Pais document in Team Topologies, the communication overhead between engineers grows quadratically: at 10 people there are 45 potential communication channels; at 100, there are nearly 5,000. At 10 engineers, you know everyone, you hear every conversation, you review most PRs. Things just work — because you're the glue holding it all together. At 100, that's impossible. The CTO who tries to manage 100 engineers the way they managed 10 will burn out, create bottlenecks, and watch quality collapse. The transition from 10 to 100 is the hardest organizational challenge a startup CTO faces, and data is the only way to navigate it without losing your mind.
{/* truncate */}
The Growth Phases (And What Breaks at Each One)
Scaling doesn't happen linearly. There are phase transitions — points where the old way of working suddenly stops working and you need to restructure.
Phase 1: The Squad (5-10 engineers)
How it works: One team, one product, one codebase. Everyone talks to everyone. The CTO is the tech lead, architect, and manager.
What works at this stage:
- Informal communication (Slack, hallway conversations)
- CTO reviews all code personally
- Hiring is "hire great people, give them problems"
- No formal process needed — velocity is high because overhead is zero
What data to track: At this stage, you barely need formal metrics. But start collecting data early so you have a baseline when you scale.
| Metric | Purpose at This Stage |
|---|---|
| Activity Time per developer | Establish individual baselines |
| Lead Time (commit to deploy) | Set your performance benchmark |
| Deployment frequency | Track how fast you ship |
The trap: Everything is so smooth that you think process is unnecessary and data is overkill. Then you hire engineer #11, and the cracks appear.
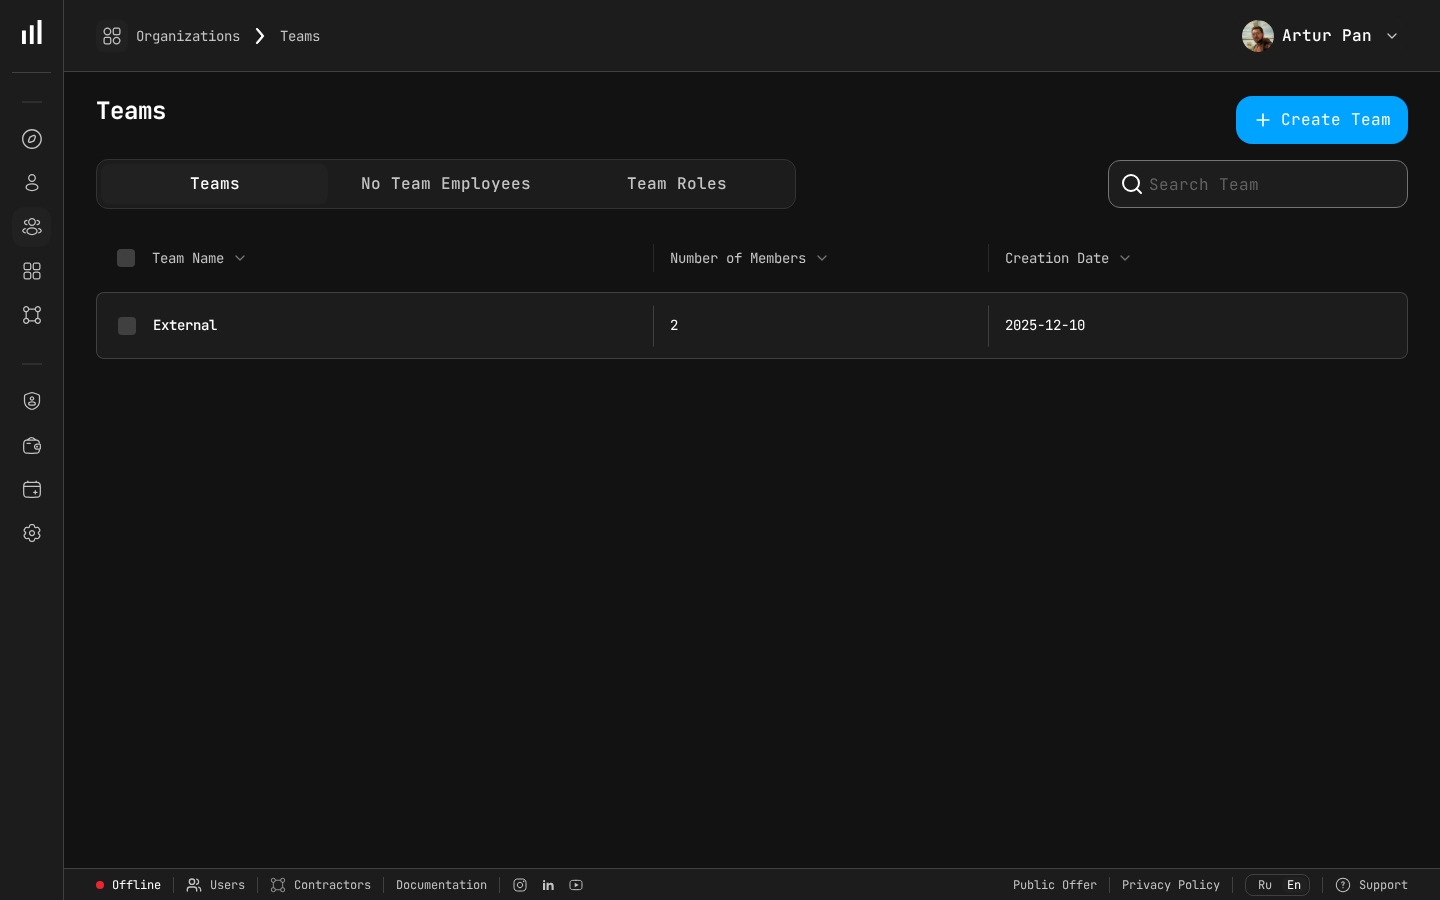 As you grow past 10 engineers, structured team management becomes essential for maintaining clarity and ownership.
Phase 2: Two Teams (10-25 engineers)
How it works: You split into 2-3 teams. You hire your first Engineering Managers (or promote senior developers). You still know everyone, but you can't be in every conversation.
What breaks:
- Communication overhead explodes. With 10 people, there are 45 communication channels. With 20, there are 190. Information stops flowing naturally.
- Coordination costs emerge. Two teams working on the same codebase step on each other. The first integration conflicts appear.
- The CTO bottleneck. If you're still reviewing all code and making all technical decisions, you're the bottleneck.
Critical data to start tracking:
| Metric | Why Now |
|---|---|
| Focus Time per team | Detect early communication overhead |
| PR cycle time | Spot review bottlenecks as team splits |
| Delivery Index | Measure if teams can deliver independently |
| Cross-team dependencies | Track how often Team A blocks Team B |
What the data tells you:
If Focus Time drops after the team split, your team boundaries are wrong — people are spending too much time coordinating across teams instead of building within their team.
If PR cycle time increases, you haven't established clear code ownership. PRs are sitting because the right reviewer isn't on the same team.
Actions:
- Hire or promote 2 Engineering Managers. Give them real authority — not the title without power.
- Establish team boundaries aligned with product architecture — Conway's Law is real, and Team Topologies provides a practical framework for this alignment.
- Implement basic sprint planning so teams can make and track commitments.
- Start running 1:1s with data — you now have enough history to make them meaningful.
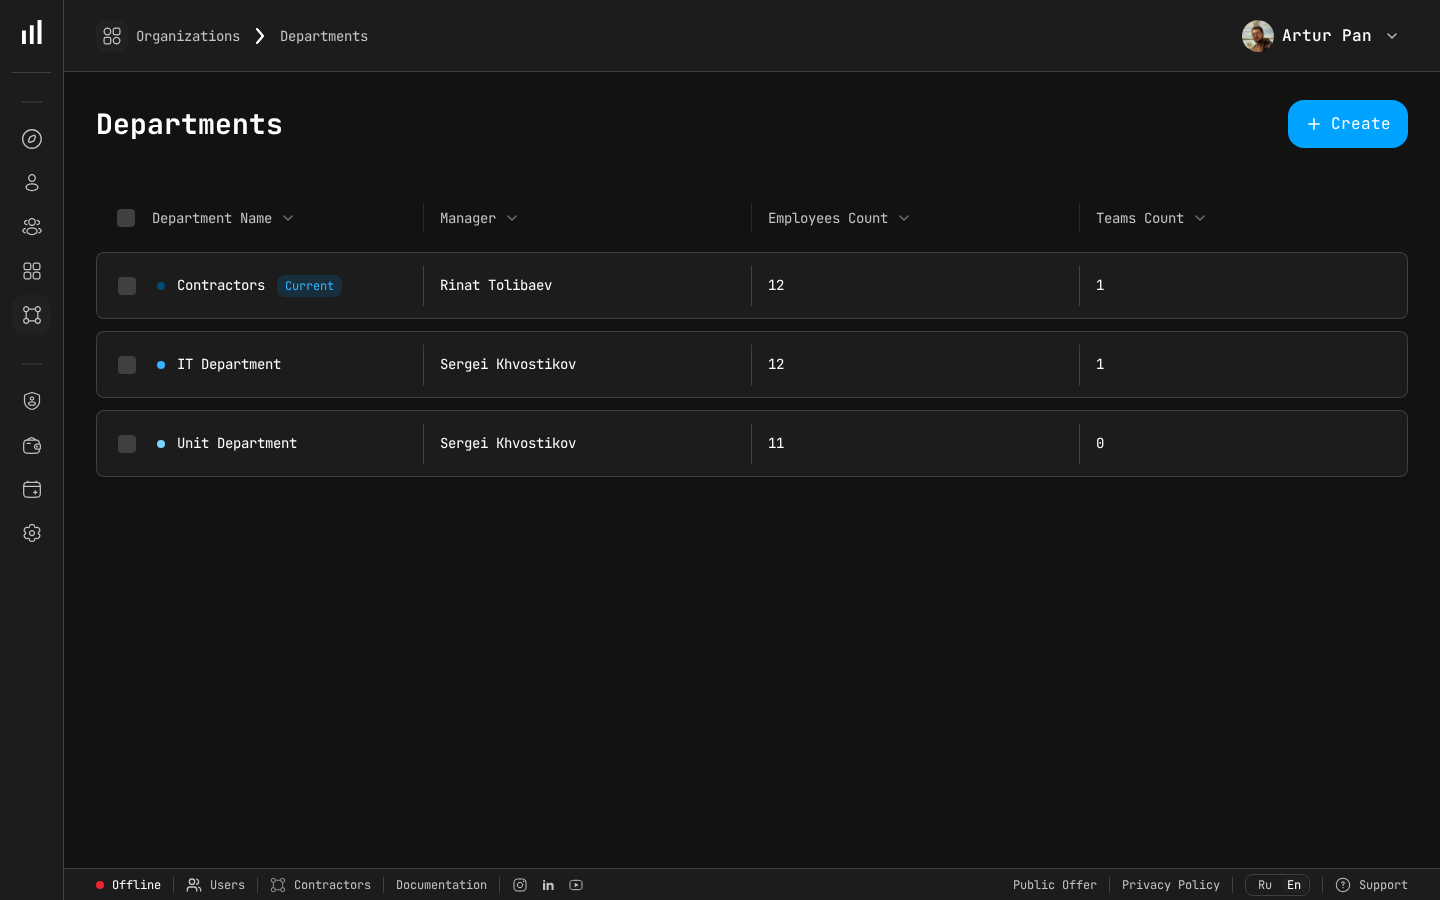 At the department stage, you need a dedicated view to manage multiple teams and their organizational hierarchy.
Phase 3: The Department (25-50 engineers)
How it works: 4-8 teams, organized into groups. You need a layer of management between you and the teams. Architecture decisions need formal processes. You can't personally onboard new hires anymore.
What breaks:
- Knowledge silos form. Teams develop their own conventions, tools, and tribal knowledge. Nobody has the full picture.
- Hiring quality varies. Different managers have different bars. Without calibration, you get inconsistency.
- Planning becomes a nightmare. Dependencies between teams mean one team's delay cascades to three others.
- Invisible work appears. You can no longer see who's doing what. Quiet high performers become invisible; loud underperformers appear more productive.
Essential data at this stage:
| Metric | Purpose |
|---|---|
| Delivery Index per team | Compare team predictability |
| Planning Accuracy | Measure organizational planning capability |
| Activity Time + Focus Time | Detect overloaded teams and individuals |
| DORA metrics (full 4-stage) | Identify pipeline and process bottlenecks |
| Cost per project | Understand where engineering investment goes |
| Team health indicators | Early warning on burnout and attrition risk |
What the data tells you:
At this scale, you're looking for systemic patterns, not individual issues:
- If three teams all have low Focus Time, you have an organization-wide meeting problem, not a team problem
- If Delivery Index varies wildly between teams (0.5 to 0.9), your planning process needs standardization
- If cost per project is trending up without corresponding scope increases, you have growing coordination overhead
- If DORA Lead Time is increasing quarter over quarter, your architecture or release process can't support your scale
Actions:
- Introduce VP Eng or Group EM roles to manage multiple teams.
- Standardize engineering processes: PR guidelines, deploy practices, sprint cadence.
- Implement formal onboarding — data shows new hires at 50+ person orgs take 30% longer to ramp without structured onboarding.
- Start running calibration sessions for performance reviews.
- Build your CTO dashboard (executive layer + leadership layer).
Phase 4: The Organization (50-100 engineers)
How it works: Multiple departments or divisions. Engineering Managers manage managers. You're setting strategy, not writing code. Culture is no longer something that "just happens" — it must be deliberately maintained.
What breaks:
- Culture dilution. Half the org has been there less than a year. They didn't absorb your values osmotically; they need explicit culture-building.
- Decision velocity drops. More people means more stakeholders, more meetings, more alignment needed before anything ships.
- Metrics gaming appears. As you grow, the incentive to look good on dashboards increases. People start optimizing for the metric, not the outcome.
- Inter-team politics emerge. Teams compete for resources, priority, and recognition. Without objective data, the loudest team wins.
Data infrastructure at this stage:
| Capability | Purpose |
|---|---|
| Department-level dashboards | CTO-level visibility into each division |
| Team-level dashboards | EM and VP Eng visibility into their teams |
| Developer dashboards | Self-service data for every engineer |
| Automated reporting | Weekly/monthly reports to leadership (Excel, PDF) |
| Role-based access control | Right data to the right people (Admin, Maintainer, Manager, Viewer, Developer) |
| Cost analytics | Per-project, per-team, per-employee cost tracking |
| AI-assisted analysis | Pattern detection across the org that humans would miss |
What the data tells you at 100 engineers:
You're now looking at organizational health and strategic alignment:
- Which departments are consistently delivering? Which are struggling? Why?
- Are we spending our engineering budget on the right things? (Cost per project + strategic priority alignment)
- Is our hiring keeping pace with demand? (Capacity utilization + delivery trends)
- Are we losing people? Where? Why? (Health indicators + exit data)
- Is our engineering efficiency improving or degrading as we scale? (Productivity Score trend)
The Metrics That Matter at Each Phase
Here's a consolidated view:
| Metric | 10 eng | 25 eng | 50 eng | 100 eng |
|---|---|---|---|---|
| Activity Time | Baseline | Per team | Per team + individual drill-down | Dept aggregate |
| Focus Time | Nice to have | Important | Essential | Critical |
| Lead Time | Baseline | Per team | 4-stage breakdown | By dept + team |
| Delivery Index | Not needed | Per team | Per team + org | Per dept/team |
| Planning Accuracy | Not needed | Start tracking | Essential | Critical |
| Cost per project | Not tracked | Nice to have | Important | Essential |
| Productivity Score | Not tracked | Not needed | Per team | Per dept + team |
| Team Health | Gut feeling | 1:1 conversations | Composite indicator | Automated monitoring |
| Role-based access | Everyone sees everything | 2 levels | 3 levels | 5 levels |
Common Scaling Mistakes (And the Data That Catches Them)
Mistake 1: Scaling Teams Too Late
Symptom: One team of 12 developers with overlapping responsibilities and constant merge conflicts.
Data signal: Focus Time declining, Lead Time increasing, and Delivery Index dropping — all simultaneously. The team is spending more time coordinating than building.
Fix: Split the team earlier than you think you need to. The threshold is usually 6-8 developers per team. Watch Focus Time after the split — if it improves, you made the right call.
Mistake 2: Promoting Without Training
Symptom: Your best developer becomes a manager, stops coding, and is miserable. The team loses their best engineer and gains a bad manager.
Data signal: The new manager's team shows declining metrics across the board in the first 2-3 months. Not because the team is bad, but because they're getting no support.
Fix: Invest in management training before the promotion. Use data to help new managers — give them a dashboard and teach them how to use it in 1:1s. It's easier to learn management when you have objective data instead of relying on intuition you haven't developed yet.
Mistake 3: Hiring Faster Than You Can Onboard
Symptom: You hired 15 engineers in one quarter. Three months later, half of them are still struggling to make meaningful contributions.
Data signal: New hire Activity Time ramp-up is much slower than historical baseline. Time-to-first-meaningful-PR is 2-3x longer than previous cohorts.
Fix: Limit concurrent new hires to what your team can absorb. A good rule of thumb: no more than 1 new hire per 4-5 existing engineers per quarter. Use onboarding metrics to track ramp-up speed and identify where your onboarding process breaks down.
Mistake 4: Ignoring Conway's Law
Symptom: Your team structure doesn't match your architecture. The "Platform" team owns code that three product teams need to modify daily.
Data signal: Cross-team PR reviews are high. Lead Time is inflated because PRs wait for reviews from other teams. Focus Time is low because of constant context switching between team priorities.
Fix: Reorganize teams around architecture boundaries. Track cross-team dependencies and minimize them. When you see two teams constantly needing each other's code, either merge them or refactor the architecture.
Mistake 5: No Visibility Into Costs
Symptom: At 10 engineers, costs are simple: salaries plus AWS. At 50+, you have no idea which project is consuming what resources, and the CFO is asking uncomfortable questions.
Data signal: You can't answer the question "how much did Feature X cost us?" and that's the data signal — the absence of data.
Fix: Implement cost tracking per project and per team early. By the time you're at 50 engineers, this should be automated and part of your standard dashboard.
The Scaling Timeline: A Realistic Roadmap
Here's a quarter-by-quarter playbook for scaling from 10 to 100 over roughly 2 years:
Quarters 1-2 (10 → 20 engineers)
| Action | Data Required |
|---|---|
| Hire first 2 EMs | Activity Time baselines to hand off |
| Split into 2-3 teams | Team-level Focus Time and Lead Time to validate split |
| Implement basic sprint planning | Start tracking Planning Accuracy |
| Begin regular 1:1s with data | Per-developer Activity Time and Focus Time |
| Establish coding standards | PR cycle time baseline |
Quarters 3-4 (20 → 40 engineers)
| Action | Data Required |
|---|---|
| Add 2-3 more teams | Cross-team dependency tracking |
| Hire/promote VP Eng or Group EM | Department-level dashboards |
| Standardize engineering processes | DORA metrics to benchmark |
| Implement structured onboarding | New hire ramp-up metrics |
| Start performance calibration | Delivery Index and peer data |
| Implement cost tracking | Per-project cost analytics |
Quarters 5-6 (40 → 70 engineers)
| Action | Data Required |
|---|---|
| Full management hierarchy in place | Role-based access control for dashboards |
| Architecture review board | Lead Time by team to spot structural issues |
| Formal career ladders | Metrics integrated into review frameworks |
| Automated reporting | Weekly team reports, monthly exec reports |
| Dedicated recruitment team | Capacity utilization data for hiring justification |
Quarters 7-8 (70 → 100 engineers)
| Action | Data Required |
|---|---|
| Multiple departments/divisions | Department-level analytics |
| Engineering-wide OKRs | Planning Accuracy and Delivery Index per OKR |
| Internal developer platform | Developer self-service dashboards |
| Data-driven budgeting | Cost per team, per project, per employee |
| AI-assisted analysis | Org-wide pattern detection |
| Culture programs | Team health monitoring at scale |
The CTO's Evolving Role
As you scale, your job changes fundamentally. Data helps you manage each transition:
| Scale | CTO Role | How Data Helps |
|---|---|---|
| 10 | Tech Lead + Manager | Baseline data collection; personal code review |
| 25 | Architect + People Leader | Team dashboards replace personal observation |
| 50 | Strategy + Organization | Department dashboards drive structural decisions |
| 100 | Executive + Culture | Organizational analytics inform company strategy |
The hardest part isn't the metrics — it's letting go. Will Larson captures this well in An Elegant Puzzle: the CTO's job is to build systems that make their own involvement unnecessary. At 10 engineers, you knew everything. At 100, you need to trust your data, your managers, and your systems. The data isn't a replacement for trust; it's what makes trust possible at scale.
Scale with confidence, not chaos. PanDev Metrics grows with your engineering org — from startup to enterprise. With department and team management, role-based access (Admin, Maintainer, Manager, Viewer, Developer), per-developer dashboards, cost analytics, and AI-assisted insights, you get the visibility you need at every stage of growth. Available on-premise or cloud.