PanDev + Jira: Linking Tasks to Real Coding Time

Your Jira board says a task took 3 days. But how much of that was actual coding? How much was waiting for review? How much was context switching between other tickets?
PanDev Metrics bridges Jira's task management with real developer activity data — commits, IDE time, code reviews — so you see the full picture. Not just "in progress" and "done," but what happened in between. The integration uses Jira's REST API and OAuth 2.0 for secure, read-only access to your project data.
{/* truncate */}
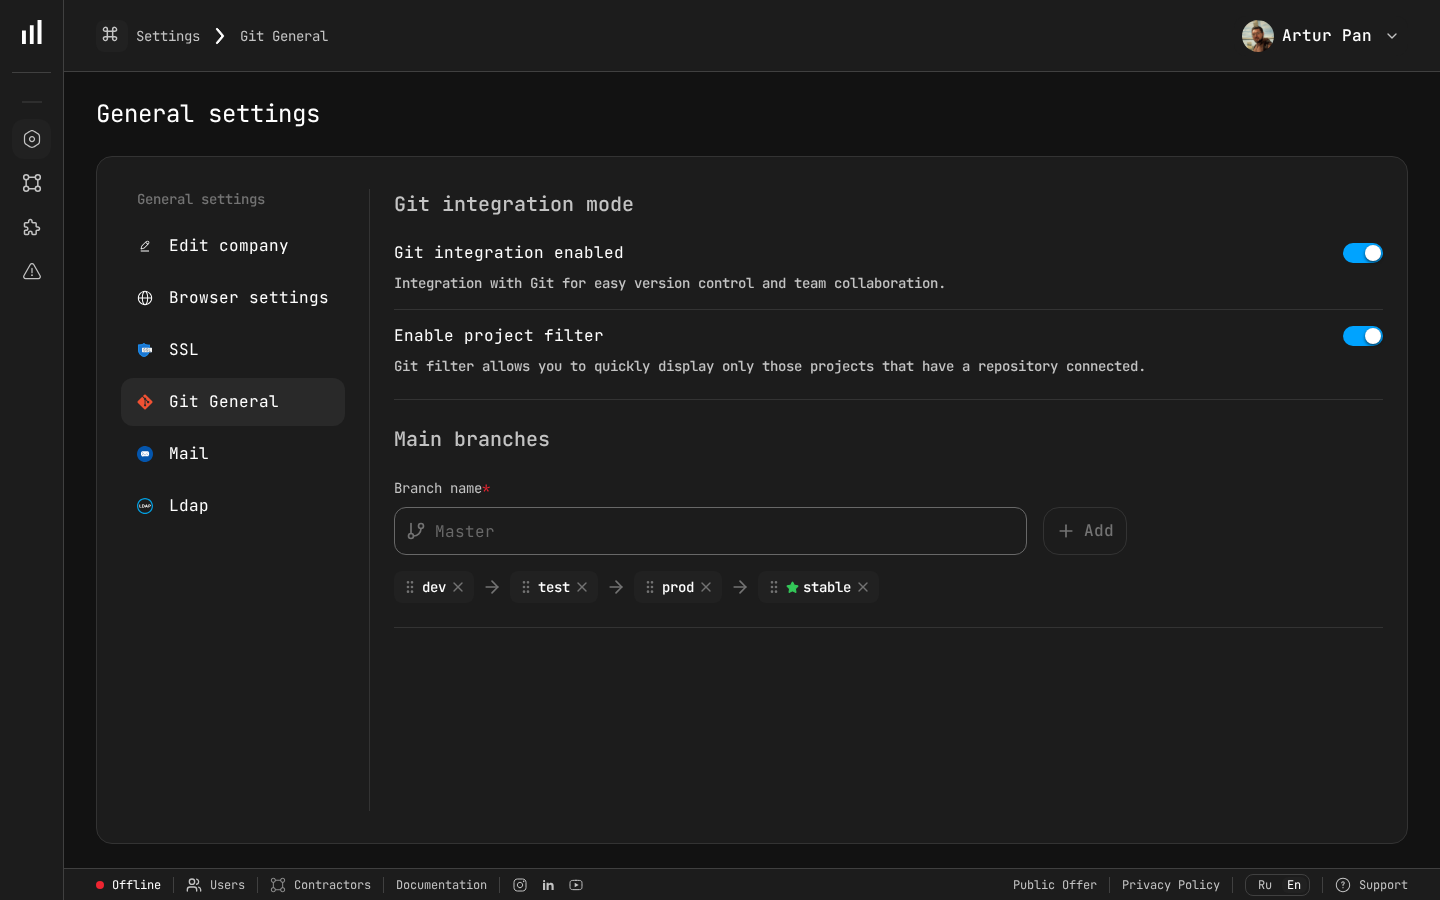
Integration settings panel in PanDev Metrics.
Why Connect Jira to PanDev?
Jira tracks workflow states — To Do, In Progress, In Review, Done. PanDev tracks actual engineering activity — commits, code reviews, IDE coding sessions.
When you connect the two, you unlock insights that neither tool provides alone:
| Insight | Jira alone | PanDev + Jira |
|---|---|---|
| Task status | ✅ | ✅ |
| Time in each status | ✅ (manual transitions) | ✅ (automatic) |
| Actual coding time per task | ❌ | ✅ |
| Code review time per task | ❌ | ✅ |
| Wait time between coding and review | ❌ | ✅ |
| Lines of code per story point | ❌ | ✅ |
| Sprint velocity (in real effort, not estimates) | ❌ | ✅ |
This is especially valuable for Engineering Managers who want to understand where time goes, and Project Managers who want better estimation data.
Prerequisites
| Requirement | Details |
|---|---|
| Jira account | Jira Cloud or Jira Data Center. Admin role for the initial setup |
| PanDev Metrics account | Admin or Manager role |
| Git integration | At least one git provider (GitLab, GitHub, Bitbucket, or Azure DevOps) already connected to PanDev |
The git integration is important — PanDev links commits to Jira issues by matching issue keys in commit messages and branch names.
Step 1: Connect Jira to PanDev
- In PanDev, go to Settings → Integrations → Jira
- Click Add Jira Connection
- Enter your Jira instance URL:
Jira URL: https://your-company.atlassian.net
- Click Connect
- Jira's OAuth consent screen appears — review the requested permissions:
PanDev Metrics wants to:
  ✅ View Jira issues and projects
  ✅ View Jira worklogs
  ✅ View Jira sprint and board data
  ✅ View user profiles
- Click Accept
You're redirected back to PanDev with a success confirmation.
Step 2: Select Projects to Sync
After connecting, PanDev lists all Jira projects your account can access:
- Browse the project list or search by name/key
- Enable the projects you want to track
- Click Save
Project              Key    Issues    Status
─────────────────────────────────────────────
Frontend App         FE     1,247     ✅ Enabled
Backend API          API    3,891     ✅ Enabled
Mobile App           MOB    682       ✅ Enabled
Internal Tools       INT    156       ⬜ Disabled
Design System        DS     94        ⬜ Disabled
:::tip Start small If you have dozens of Jira projects, start with 2-3 active engineering projects. You can add more later without losing data. :::
Step 3: Configure Issue Key Matching
This is the magic link between Jira and your git activity. PanDev matches Jira issue keys found in:
- Commit messages —
FE-1234: Fix login button alignment - Branch names —
feature/FE-1234-login-fix - Pull request titles —
[FE-1234] Fix login button alignment - Pull request descriptions — any mention of
FE-1234
PanDev detects these patterns automatically. No configuration needed if your team follows standard naming conventions.
Custom Matching Rules
If your team uses non-standard patterns, you can add custom rules:
Settings → Integrations → Jira → Matching Rules

Default patterns (always active):
  ✅ [PROJECT_KEY]-[NUMBER] in commit messages
  ✅ [PROJECT_KEY]-[NUMBER] in branch names
  ✅ [PROJECT_KEY]-[NUMBER] in PR titles and descriptions

Custom patterns:
  + Add pattern: "task/([A-Z]+-\d+)" → extract issue key from branch names like task/FE-1234-description
  + Add pattern: "closes #(\d+)" → match numeric-only references (requires project context)
Step 4: Sync Worklogs (Optional)
If your team logs time in Jira, PanDev can import worklog data and compare it with actual IDE activity:
- Go to Settings → Integrations → Jira → Worklog Sync
- Toggle Enable Worklog Sync
- Choose sync frequency:
Sync frequency:
  ○ Every hour
  ◉ Every 4 hours (recommended)
  ○ Once daily
Once enabled, PanDev creates a comparison view:
| Task | Jira Logged | IDE Active | Git Active | Difference |
|---|---|---|---|---|
| FE-1234 | 4h | 2h 15m | 1h 48m | Jira overestimated by 1h 45m |
| FE-1235 | 2h | 3h 30m | 2h 52m | Jira underestimated by 1h 30m |
| API-891 | 8h | 6h 10m | 5h 22m | Jira overestimated by 1h 50m |
This isn't about catching people — it's about improving estimation accuracy over time. Research consistently shows that self-reported time logs diverge from actual activity by 20-40%, making automated tracking a practical upgrade for any team that relies on time data for planning.
Step 5: Map Jira Users to PanDev Profiles
For cross-platform analytics, PanDev needs to know which Jira user is which team member:
- Go to Settings → Team Management
- PanDev shows detected Jira usernames alongside any existing GitHub/GitLab mappings
- Confirm or correct the auto-matches
Team Member        GitHub          GitLab          Jira
───────────────────────────────────────────────────────────
Anna Chen          @achen          @anna.chen      anna.chen@company.com  ✅
Boris Kim          @bkim           —               boris.kim@company.com  ✅
Carlos Diaz        @cdiaz          @carlos.d       carlos@company.com     ⚠️ Review
If a team member's Jira email differs from their git email, add both as aliases.
Step 6: Explore the Jira Dashboard
With data flowing, PanDev creates several Jira-specific views:
Task-Level Metrics
Click any Jira issue in PanDev to see its full engineering timeline:
FE-1234: Fix login button alignment
━━━━━━━━━━━━━━━━━━━━━━━━━━━━━━━━━━━━━

Jira Status Flow:
  To Do ──(2d)──▸ In Progress ──(1d 3h)──▸ In Review ──(4h)──▸ Done

Actual Engineering Activity:
  Mar 5, 10:23  First commit (anna.chen)          +45 / -12 lines
  Mar 5, 11:07  Second commit (anna.chen)          +23 / -8 lines
  Mar 5, 14:30  PR opened → backend-api#342
  Mar 5, 16:15  Review comment (boris.kim)
  Mar 6, 09:45  Fix commit (anna.chen)             +7 / -3 lines
  Mar 6, 10:12  PR approved (boris.kim)
  Mar 6, 10:30  PR merged

Total coding time (IDE):    2h 15m
Total review time:          45m
Wait time (coding → review): 1h 45m
Wait time (review → merge):  17m
Sprint Analytics
PanDev's sprint view goes beyond velocity charts:
| Sprint Metric | What it shows |
|---|---|
| Planned vs. Delivered | Story points committed vs. completed |
| Real Effort Distribution | How coding time splits across tasks in the sprint |
| Carry-over Analysis | Tasks that spilled into the next sprint and their actual progress |
| Review Bottleneck | Tasks that spent more time waiting for review than being coded |
| Scope Creep | Tasks added mid-sprint and their impact on delivery |
Epic-Level Rollup
For longer-term planning, PanDev aggregates data at the epic level:
Epic: User Authentication Revamp (AUTH)
━━━━━━━━━━━━━━━━━━━━━━━━━━━━━━━━━━━━━━

Tasks:           23 total, 19 completed, 4 in progress
Total coding:    127 hours across 6 developers
Total reviews:   34 hours
Avg cycle time:  2.3 days per task
Avg PR size:     +142 / -67 lines
Story points:    89 (estimated) → 97 (actual)
Step 7: Set Up Alerts and Reports
Automated Alerts
Configure alerts for common Jira workflow issues:
Settings → Alerts → Jira

Available alerts:
  ✅ Task in "In Progress" with no commits for 48+ hours
  ✅ Task in "In Review" with no PR review activity for 24+ hours
  ✅ Sprint at risk — less than 60% of points completed by mid-sprint
  ⬜ Task cycle time exceeds 2x team average

Notification channel: Slack #engineering-leads
Weekly Sprint Reports
PanDev generates a weekly report combining Jira and git data:
Settings → Reports → Sprint Report

Recipients: engineering-managers@company.com
Frequency: Every Monday at 09:00
Include:
  ✅ Sprint progress vs. plan
  ✅ Top contributors by coding time
  ✅ Review bottleneck analysis
  ✅ Cycle time trend
  ✅ Carry-over tasks
Common Patterns and Tips
Pattern 1: The "In Progress but Idle" Detector
One of the most valuable alerts. If a Jira task has been "In Progress" for 2+ days but PanDev shows zero commits, branches, or IDE activity, something is wrong:
- The developer is blocked and hasn't communicated it
- The task was moved to "In Progress" prematurely
- The developer is working on it but forgot to push commits
This isn't micromanagement — it's early detection of blockers.
Pattern 2: Estimation Calibration
After 3-4 sprints of combined Jira + PanDev data, you have enough data to calibrate estimates:
Historical data for "Small" tasks (1-2 story points):
  Average actual coding time:  3.2 hours
  Average review time:         1.1 hours
  Average total cycle time:    1.4 days

Historical data for "Medium" tasks (3-5 story points):
  Average actual coding time:  8.7 hours
  Average review time:         2.3 hours
  Average total cycle time:    3.1 days
Use this data in sprint planning to make more realistic commitments.
Pattern 3: Review Load Balancing
PanDev shows which team members handle the most code reviews relative to their coding time. If one person spends 40% of their time reviewing while others spend 5%, you have a bottleneck.
Troubleshooting
| Issue | Solution |
|---|---|
| No issues syncing | Check that Jira OAuth token hasn't expired. Re-authorize in Settings → Integrations → Jira |
| Issues sync but no commit links | Ensure your team uses Jira issue keys in commit messages or branch names |
| Worklog times don't match | PanDev and Jira may use different timezone settings. Align them in Settings → Organization |
| Missing sprint data | PanDev requires Jira board access. Ensure the connected account can view boards, not just backlogs |
Next Steps
With Jira connected, you've built a bridge between project management and engineering reality. Here's what to explore:
- Sprint retrospectives — use PanDev's sprint report as a data-driven input
- Estimation workshops — show historical coding time per story point size
- Cross-team comparisons — compare cycle time patterns across teams (carefully and with context)
- AI assistant — ask "Which tasks took longer than estimated last sprint?" in natural language
See where your sprint time really goes. Connect Jira to PanDev Metrics and turn status updates into engineering intelligence.