Technical Debt: How to Show Your CEO That Refactoring Is an Investment

Every CTO has had this conversation. You walk into the CEO's office and say, "We need to spend the next quarter refactoring." The CEO asks, "What's the business value?" You struggle to answer in terms that don't involve the words "architecture," "coupling," or "dependency injection." The DORA State of DevOps Reports consistently find that teams burdened by technical debt deploy ~50% less frequently and have ~2-3x higher change failure rates.
The CEO isn't wrong to ask. They're not anti-engineering. They just need to understand the investment in business terms. And that's where most CTOs fail — not because they're bad communicators, but because they don't have the right data.
Here's how to fix that.
{/* truncate */}
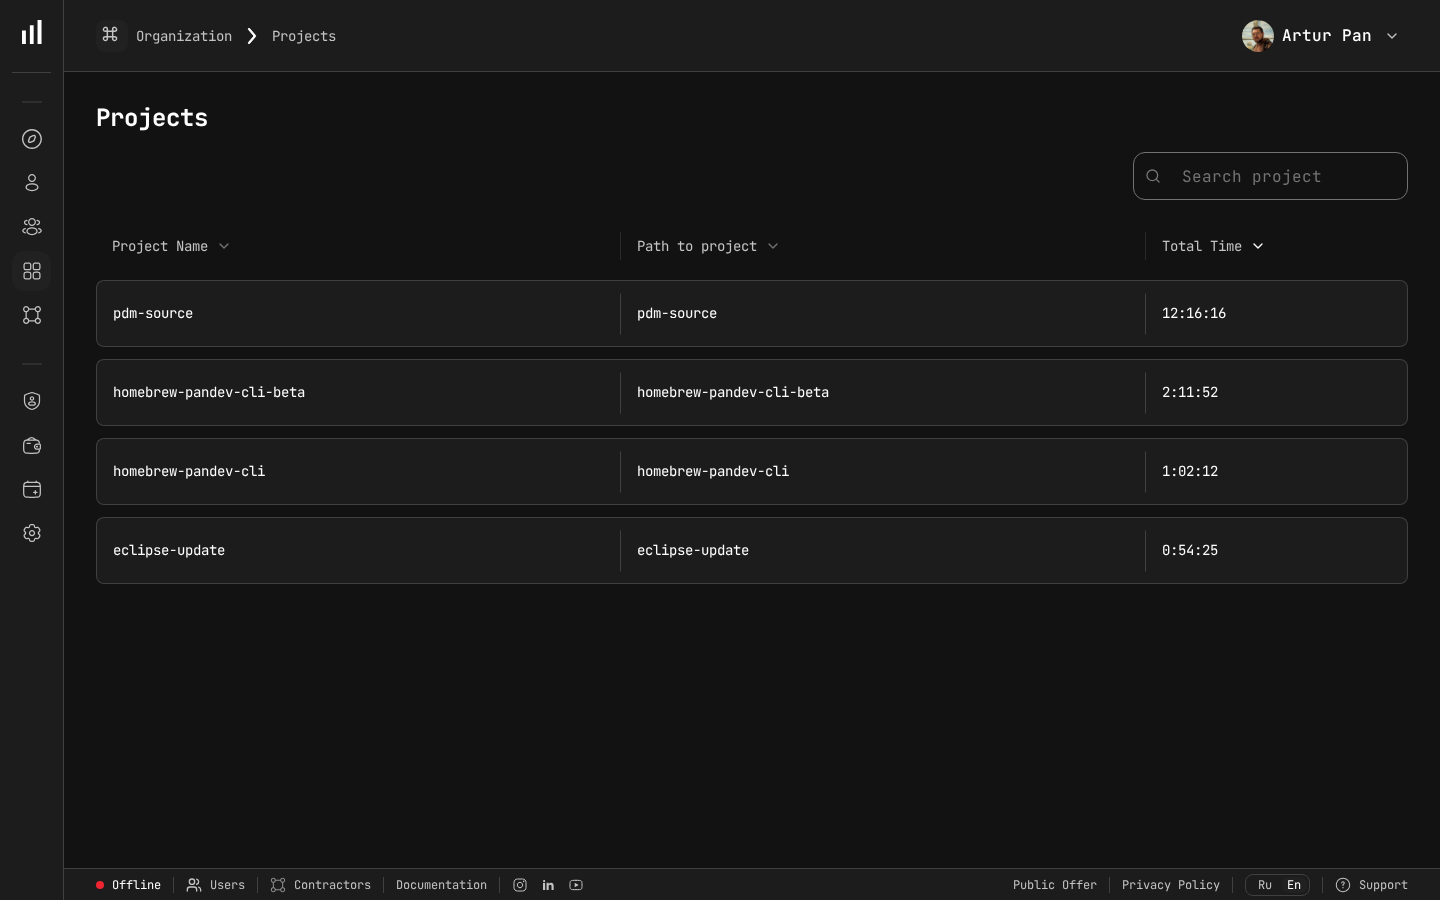
Project time tracking showing where engineering hours actually go.
Why the Refactoring Conversation Fails
The typical refactoring pitch goes like this:
CTO: "Our backend has accumulated significant technical debt. The authentication module is tightly coupled to the billing system. We need 6 weeks to refactor it."
CEO: "What happens if we don't?"
CTO: "It'll be harder to add features."
CEO: "How much harder? Can you quantify it?"
CTO: "...It's hard to quantify."
And that's where the conversation dies. The CEO makes a reasonable business decision: without quantified cost, they prioritize work that has quantified value (new features, customer requests).
The CTO walks away frustrated, convinced the CEO "doesn't get it." But the real problem isn't the CEO's understanding — it's the CTO's inability to present the data.
Technical Debt Has a Measurable Cost
Technical debt isn't an abstract concept. It manifests as concrete, observable effects on developer activity:
1. Slower Feature Development
When code is tangled, every new feature takes longer. A change that should take 2 days takes 5 because the developer has to understand and work around accumulated complexity.
How to measure it: Track how long similar-sized features take over time. If features that took 1 week six months ago now take 2 weeks, you can calculate the cost:
Extra time per feature × developer daily cost × number of features per quarter = quarterly debt tax
2. More Context-Switching
Legacy codebases with poor separation of concerns force developers to touch multiple files and modules for simple changes. This creates fragmented coding sessions — developers jump between files, lose context, and spend time re-orienting.
How to measure it: PanDev Metrics tracks coding session patterns. Shorter, more fragmented sessions compared to historical baselines can indicate growing architectural complexity. With extensive activity data in our dataset, we can see these patterns clearly.
3. Longer Debugging Sessions
Technical debt makes bugs harder to find and fix. When modules are tightly coupled, a bug's symptoms appear far from its cause. Developers spend hours tracing through layers of indirection.
How to measure it: Track time spent on bug fixes versus new features over time. An increasing proportion of time on bug fixes is a debt signal.
4. Onboarding Slowdown
New developers ramp up slower in debt-heavy codebases. Complex, undocumented, tangled code takes longer to understand. This has a direct cost (see our article on developer onboarding).
How to measure it: Compare onboarding ramp-up times across different periods. If new hires are taking longer to reach full productivity, debt is likely a factor.
5. Reduced Developer Satisfaction and Retention
This one is harder to quantify but has the highest cost. Developers leave companies with painful codebases. The Stack Overflow Developer Survey consistently ranks "working with legacy code" and "poor tooling" among the top reasons developers consider leaving. Replacing a developer costs ~50-200% of their annual salary in recruiting, onboarding, and lost productivity.
How to measure it: Exit interviews, developer satisfaction surveys, and Glassdoor reviews all provide qualitative signals. Combined with activity data showing declining coding engagement, you have a compelling narrative.
Building the Business Case: A Framework
Here's a step-by-step approach to making the refactoring case in terms a CEO understands.
Step 1: Quantify the Current "Debt Tax"
The debt tax is the amount of developer time consumed by working around technical debt rather than delivering new value. Calculate it like this:
Method A: Time-based comparison
- Estimate how long a typical feature should take (based on similar features in cleaner parts of the codebase)
- Measure how long it actually takes in the debt-heavy area
- The difference is the debt tax per feature
- Multiply by the number of features per quarter
Example: If the debt-heavy area adds 3 extra days to every feature, and you ship 12 features per quarter, that's 36 developer-days — roughly $25,000-$35,000 per quarter at senior developer rates.
Method B: Activity-based measurement
- Use PanDev Metrics to track coding patterns over time
- Identify declining efficiency (shorter sessions, more fragmented work, lower total coding hours)
- Correlate with the accumulation of known technical debt items
Step 2: Project the Future Cost of Inaction
Technical debt compounds. If the debt tax is $30K/quarter today and growing at 20% per year:
| Quarter | Quarterly Debt Tax | Cumulative Annual Cost |
|---|---|---|
| Q1 2026 | $30,000 | — |
| Q2 2026 | $31,500 | — |
| Q3 2026 | $33,000 | — |
| Q4 2026 | $34,500 | $129,000 |
| Q4 2027 (projected) | $41,500 | $155,000 |
Show this trajectory. CEOs understand compound costs.
Step 3: Estimate the Refactoring Investment
Be specific and honest:
- Number of developers needed
- Duration in weeks
- Total cost (developer-weeks × loaded cost)
- What feature work will be deferred
Example: "We need 3 developers for 6 weeks = 18 developer-weeks. At $10K/week loaded cost, the investment is $180K. During this time, we'll defer the analytics dashboard and the API v3 migration."
Step 4: Calculate the ROI
Compare the refactoring cost to the projected debt savings:
Example: "$180K investment eliminates ~$120K/year in debt tax. Payback period: 18 months. Plus: faster feature delivery, easier onboarding for the 4 hires we're planning, and reduced risk of a major incident in the billing system."
Step 5: Add the Risk Factor
CEOs are risk-aware. Quantify the downside of inaction:
- "If the authentication-billing coupling causes a production incident, estimated cost is $X in downtime and customer impact"
- "If senior developer Y leaves due to codebase frustration (they've mentioned it), replacement cost is $Y"
- "If we can't deliver Feature Z on time due to debt, the revenue impact is $Z"
The Right Language
When presenting to a CEO, translate engineering concepts:
| Engineering Language | CEO Language |
|---|---|
| Technical debt | Maintenance backlog that slows delivery |
| Refactoring | Infrastructure investment that accelerates future delivery |
| Code coupling | Interdependencies that create risk and slow changes |
| Test coverage | Quality assurance that prevents costly incidents |
| Architecture improvements | Structural changes that reduce operating cost |
Don't say: "The code is a mess and we need to fix it."
Say: "We're spending an estimated $120K/year in reduced developer productivity due to structural issues in our billing module. A $180K investment in Q2 will eliminate this recurring cost, accelerate feature delivery by an estimated 25%, and reduce the risk of billing-related incidents."
Using Data to Support the Case
This is where engineering intelligence platforms like PanDev Metrics add enormous value to the conversation.
Before and After Metrics
Establish baseline measurements before the refactoring and track improvements after:
- Feature delivery time: Average days from ticket start to merge
- Coding hours per feature: Tracked via IDE heartbeats
- Session fragmentation: Average session length as a proxy for focus quality
- Bug fix ratio: Proportion of time on fixes vs. new development
- Onboarding speed: Ramp-up time for new hires
Present these as a dashboard to the CEO. Numbers are more persuasive than narratives.
Weekly Progress During Refactoring
One of the CEO's biggest fears with refactoring is: "How do I know the team is actually making progress and not just gold-plating?"
Activity data provides transparency. During the refactoring period, show:
- Total coding hours on refactoring tasks (proving the team is actively working)
- Proportion of codebase touched (showing scope progress)
- Test coverage changes (showing quality improvement)
This transparency builds trust and makes future refactoring proposals easier to approve.
Common Objections and Responses
"Can we do it incrementally instead?"
Sometimes yes, sometimes no. Incremental refactoring works for localized debt. Structural problems (like tightly coupled modules) often require a concentrated effort. Present both options with timeline and cost comparisons.
"What features are we delaying?"
Have a specific answer. List the features that will be deferred, their expected value, and why the refactoring ROI exceeds the deferral cost. If you can't show that, the CEO is right to question the priority.
"How do I know this won't happen again?"
Acknowledge that technical debt is ongoing. Propose a sustainable approach: allocate ~10-20% of sprint capacity to continuous debt reduction. SaaStr benchmarks suggest that high-performing SaaS engineering teams allocate ~15-20% of capacity to platform health and debt reduction as a standard practice. Show how tracking tools like PanDev Metrics can provide early warnings before debt accumulates to crisis levels.
"Can we hire contractors to do it?"
Usually no. Refactoring requires deep system knowledge. Contractors can write new features but are the wrong tool for restructuring existing code. Explain that this requires your most experienced developers, which is exactly why it has an opportunity cost.
Conclusion
The refactoring conversation fails when CTOs speak in engineering terms to a business audience. The fix is data: quantify the debt tax, project the cost of inaction, estimate the investment, and calculate the ROI.
Engineering intelligence tools make this possible by providing concrete activity metrics — not opinions, not estimates, but measured data about how developer time is being spent.
Your CEO isn't the enemy of good engineering. They just need the same thing you'd want if someone asked you for a $180K investment: a clear business case backed by data.
Build the business case with data. PanDev Metrics tracks developer activity patterns over time — giving CTOs the numbers they need to justify engineering investments.