Telecom: Managing Large Engineering Organizations (500+)

Managing a 500+ developer organization in telecom is like running a small city. You have infrastructure teams maintaining critical network systems, product teams building customer-facing applications, platform teams supporting internal tooling, and integration teams connecting it all together. They span multiple offices, time zones, and sometimes countries.
At this scale, you can't rely on tribal knowledge, weekly syncs, or management intuition. You need data. Engineering metrics provide the systematic visibility that makes large-scale engineering management possible.
{/* truncate */}
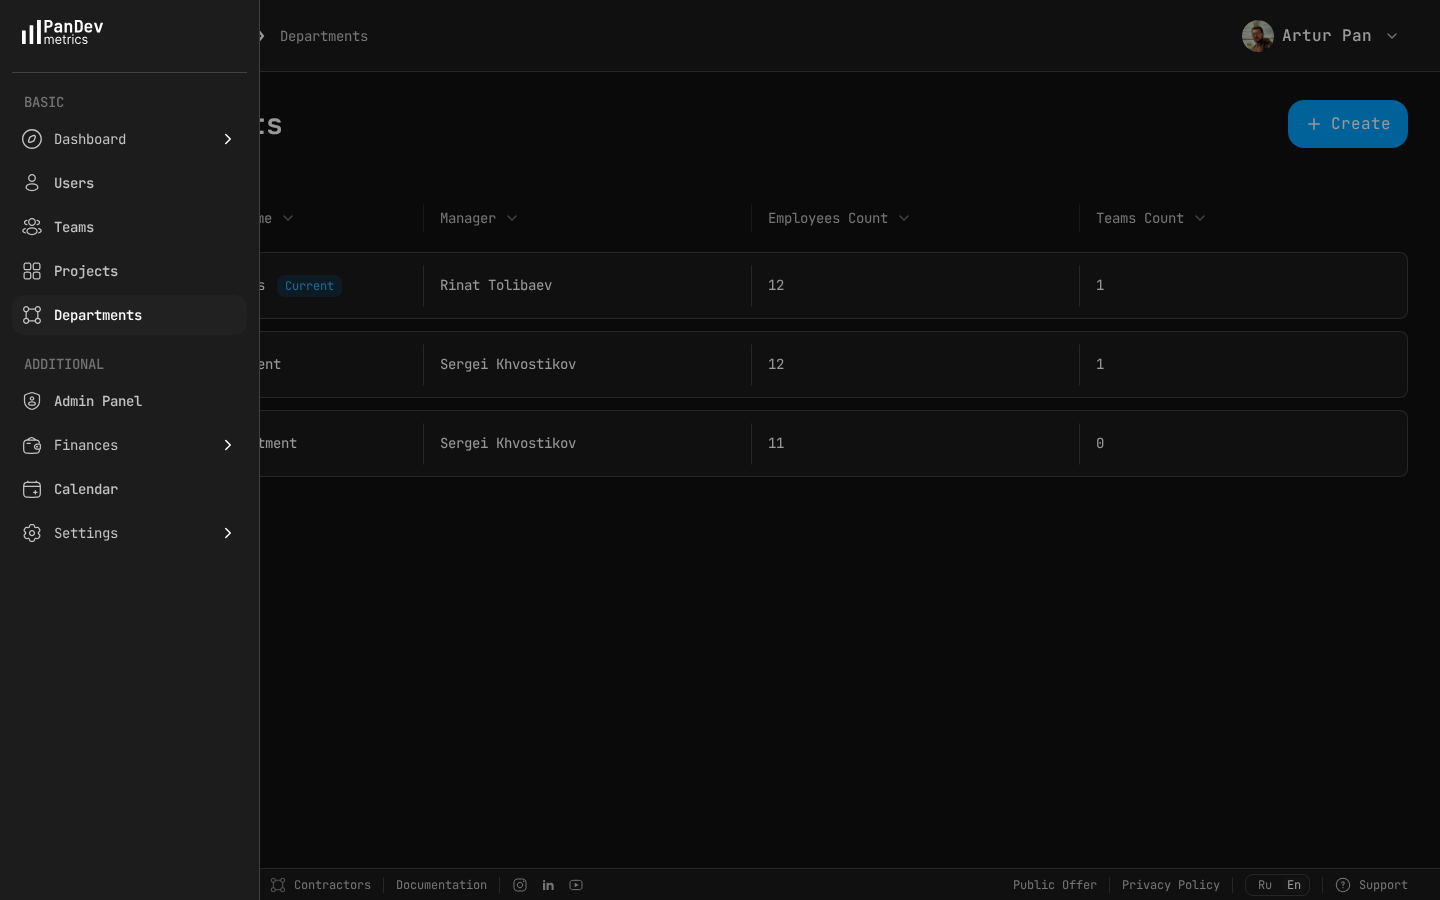
Department structure view for managing large engineering organizations.
The Unique Challenges of Telecom Engineering at Scale
Telecom engineering organizations face challenges that are rare in other industries. The TM Forum's Open Digital Architecture framework recognizes this complexity and provides a reference model, but translating it into practical engineering management requires data.
Critical Infrastructure With Zero Tolerance for Downtime
Telecom systems carry emergency calls, enable financial transactions, and support critical government communications. Downtime isn't measured in lost revenue alone — it's measured in regulatory penalties, contractual SLA violations, and potential safety impact.
This creates extreme tension: you need to innovate (5G rollout per 3GPP Release 18 timelines, edge computing, IoT platforms), but you can't risk destabilizing production systems.
Legacy and Modern Systems Coexisting
A typical telecom engineering organization maintains:
- Legacy systems (10-20+ years old) — billing platforms, provisioning systems, network management
- Transitional systems — legacy systems being modernized or replaced
- Modern platforms — cloud-native services, APIs, customer apps
- Embedded systems — network equipment firmware, edge devices
Each category requires different engineering practices, different deployment cadences, and different metrics expectations.
Multi-Site, Multi-Team Coordination
500+ developers typically means:
- 50+ teams across multiple functional areas
- Multiple geographic locations
- Different technology stacks and toolchains
- Various development methodologies (some teams use agile, others use more formal processes for safety-critical systems)
Coordinating across this landscape without engineering metrics is like navigating without a map.
Regulatory and Compliance Requirements
Telecom is heavily regulated. The TM Forum Frameworx and 3GPP standards define not just what you build but how development cycles are structured. Engineering practices must comply with:
- Telecommunications standards and certifications
- Data privacy regulations (GDPR, the ePrivacy Directive, national telecom privacy laws)
- Network security requirements
- SLA commitments to business and government customers
The Metrics Framework for 500+ Engineers
Tier 1: Organization-Wide Health Indicators
At the VP of Engineering level, you need a small set of metrics that tell you whether the overall organization is healthy:
Aggregate Deployment Frequency: Total deployments across all teams, trended weekly. This is your top-level indicator of organizational throughput. If total deployment frequency is declining while headcount is growing, something systemic is wrong.
Organization-Wide Change Failure Rate: The percentage of deployments that cause incidents, rolled back, or require hotfixes. This is your quality indicator. In telecom, this metric should be low and stable — any upward trend requires immediate investigation.
Mean Time to Recovery (MTTR) for Critical Services: Telecom SLAs often require recovery within minutes. Track MTTR for Tier 1 services separately from everything else.
Engineering Activity Distribution: How is the organization's time split across new development, maintenance, bug fixes, and infrastructure work? In large telecom organizations, maintenance often consumes 50-70% of engineering capacity. If this ratio is increasing, you're accumulating technical debt faster than you're addressing it.
PanDev Metrics aggregates these metrics across your entire development organization, pulling from all connected Git platforms and IDE activity data.
Tier 2: Department-Level Metrics
Below the organization level, each department (network engineering, platform engineering, product engineering, etc.) needs its own metrics:
DORA Metrics by Department: Each department will have different baseline expectations. Network engineering might deploy weekly with very low change failure rates. Product engineering might deploy daily with slightly higher (but still acceptable) failure rates. The key is tracking trends within each department, not comparing across departments with different risk profiles.
Cross-Department Dependency Metrics: How long do changes that require cross-department coordination take compared to changes within a single department? In large telecom organizations, this ratio is often 5-10x. Reducing it — through better APIs, clearer interfaces, or organizational restructuring — is one of the highest-leverage improvements a VP of Engineering can make.
Capacity Allocation: How is each department allocating engineering effort? This is critical for portfolio management:
- Is the network team spending enough time on 5G initiatives?
- Is the platform team investing in developer experience for the rest of the organization?
- Is the product team managing technical debt alongside feature delivery?
Tier 3: Team-Level Metrics
Individual teams (5-10 engineers) need granular metrics:
Team DORA Metrics: Deployment frequency, lead time, change failure rate, and MTTR specific to the team's services. These are the metrics team leads use for continuous improvement.
Focus Time: Large organizations are notorious for meeting overload. PanDev Metrics' IDE heartbeat tracking shows how much uninterrupted coding time developers actually get. If your organization's average Focus Time is under 2 hours per day, your meeting culture is your biggest productivity problem — not tools, processes, or technical debt.
Activity Time Distribution: At the team level, understanding the split between feature work, bug fixes, maintenance, and code review helps team leads manage their backlog and communicate capacity to stakeholders.
Code Review Metrics: In large organizations, code review bottlenecks are common. Track review wait time, review throughput, and review quality (measured by whether reviewed code has a lower change failure rate).
Implementing Metrics at Scale
The Infrastructure Challenge
At 500+ developers, metrics infrastructure itself becomes a significant consideration:
On-Premise Deployment: Telecom companies handle sensitive network data and customer information. PanDev Metrics supports full on-premise deployment, ensuring engineering data stays within your corporate infrastructure.
LDAP/SSO Integration: With 500+ developers, manual user management is impractical. PanDev Metrics integrates with LDAP and SSO systems, automatically syncing team structures and access controls.
Multi-Tenancy: Different departments, business units, or subsidiaries may need isolated views of their engineering data while leadership sees the aggregate. PanDev Metrics' multi-tenancy support handles this natively.
Git Platform Coverage: Large telecom organizations often use multiple Git platforms — GitLab for some teams, GitHub for others, Bitbucket for legacy projects, Azure DevOps for teams that migrated from TFS. PanDev Metrics integrates with all four, providing a unified view regardless of which platform each team uses.
IDE Coverage: Similarly, different teams use different IDEs. Network engineers might use Eclipse or specialized tools. Web developers use VS Code. Mobile developers use Android Studio or Xcode. PanDev Metrics supports 10+ IDEs, ensuring coverage across your diverse technology landscape.
The Rollout Strategy
Don't try to deploy metrics to 500 developers simultaneously. Use a phased approach:
Phase 1: Pilot (4-6 weeks, 2-3 teams)
- Select teams that are willing and representative of different parts of the organization
- Deploy PanDev Metrics, connect Git platforms, install IDE plugins
- Collect baseline data
- Refine dashboards and reporting based on pilot feedback
Phase 2: Department Rollout (8-12 weeks, 1-2 departments)
- Extend to all teams within selected departments
- Establish department-level dashboards
- Train team leads on metrics interpretation
- Begin weekly metrics review cadence
Phase 3: Organization-Wide (12-16 weeks, all teams)
- Extend to remaining departments
- Build organization-wide dashboards for VP/C-level view
- Integrate with existing reporting and governance processes
- Establish quarterly metrics review cadence for leadership
Phase 4: Optimization (Ongoing)
- Use metrics to identify systemic improvement opportunities
- Track improvement initiatives against metrics baselines
- Refine metrics and dashboards based on evolving needs
Change Management
Deploying engineering metrics in a large organization is as much a change management challenge as a technical one:
Address the surveillance concern immediately. In a unionized or works-council environment (common in European telecom), this is especially critical. Be explicit: metrics are for team and organization health, not individual performance evaluation.
Start with teams that want it. Early adopters will generate success stories that make broader adoption easier. Forced adoption creates resistance.
Show value before asking for compliance. If the first thing teams see from metrics is criticism, they'll resist. If the first thing they see is "your review wait time is 3 days — here's how to fix it," they'll engage.
Involve team leads in dashboard design. The people who will use the data daily should have input on what's shown and how.
Using Metrics to Drive Organizational Decisions
Build vs. Buy vs. Modernize
Large telecom organizations constantly face decisions about legacy systems: do we maintain them, modernize them, or replace them? Engineering metrics inform this decision:
- Maintenance cost: What percentage of team capacity goes to maintaining the legacy system?
- Change failure rate: Is the legacy system inherently fragile?
- Lead time: How long do changes take in the legacy system vs. modern equivalents?
- MTTR: How quickly can the team recover from incidents in the legacy system?
If a legacy system consumes 60% of a team's capacity, has a 15% change failure rate, and a 4-hour MTTR, the business case for modernization writes itself — with data, not opinions.
Headcount Planning
At 500+ developers, every hiring decision matters:
- Are existing engineers productive? If Focus Time is low across the organization, hiring more engineers won't increase output — reducing meetings will.
- Where is capacity actually needed? Activity distribution data shows which teams are overloaded (high Activity Time, declining deployment frequency) and which have capacity.
- What's the cost of a new hire? Financial analytics show the actual cost per deployment, per feature, and per team — helping you justify or challenge headcount requests.
Vendor and Contractor Management
Telecom organizations often use significant contractor workforces. Engineering metrics provide objective assessment of contractor team performance:
- Are contractor teams deploying at the same frequency as internal teams?
- Is their change failure rate comparable?
- Are they contributing to code review and knowledge sharing?
- How does their Focus Time compare? (Contractors with excessive meetings might indicate poor onboarding)
Platform and Tooling Investment
With 500+ developers, tooling decisions have enormous leverage. Engineering metrics help you:
- Measure the impact of tool changes: If you migrate from Jenkins to GitLab CI, does lead time actually improve?
- Identify tooling bottlenecks: If build times are consuming 30 minutes per deployment across 50 teams deploying daily, that's 25 hours of waiting per day
- Justify platform team investment: Show how internal platform improvements affect downstream teams' metrics
Common Patterns in Large Telecom Organizations
The "Islands of Excellence" Problem
In every large engineering organization, some teams perform exceptionally well while others struggle. Without metrics, the struggling teams are invisible until they cause an incident.
Engineering metrics make performance variation visible:
- Department A deploys 15 times per week with a 2% change failure rate
- Department B deploys 3 times per week with an 8% change failure rate
The question isn't "why is Department B bad?" — it's "what's different about their context, and can we help?"
The Coordination Tax
As organizations grow, the percentage of time spent on coordination increases non-linearly. Metrics quantify this:
- Track the ratio of Focus Time to Activity Time across the organization
- Track lead time for cross-team changes vs. within-team changes
- Monitor meeting time trends (inverse of Focus Time)
If Focus Time has declined 20% over the past year while headcount grew 30%, your coordination overhead is growing faster than your capacity.
The Technical Debt Spiral
Large organizations often enter a technical debt spiral:
- Maintenance burden increases, consuming more engineering capacity
- Less capacity for new features, so features are rushed
- Rushed features create more technical debt
- Maintenance burden increases further
Activity distribution metrics make this spiral visible before it becomes a crisis. If the organization-wide split between new development and maintenance shifts by more than 5% per quarter, it's time to invest in debt reduction.
Financial Visibility at Scale
At 500+ engineers, the engineering budget is likely tens of millions of dollars annually. PanDev Metrics' financial analytics provide:
- Cost per deployment across the organization
- Cost per team correlated with output metrics
- Cost of maintenance vs. cost of new development
- ROI of improvement initiatives (did the platform investment actually reduce lead times?)
This data is essential for board-level reporting, budget planning, and strategic decision-making.
Getting Started
For a VP of Engineering managing 500+ developers:
- Identify your pilot teams — choose 2-3 teams from different departments
- Deploy PanDev Metrics on-premise with LDAP/SSO integration
- Connect all Git platforms used across the organization
- Start IDE plugin deployment with pilot teams
- Collect 4-6 weeks of baseline data before drawing conclusions
- Expand department by department based on pilot learnings
- Build the organizational dashboard once 3+ departments are onboarded
At scale, engineering metrics aren't a nice-to-have. They're the operating system for managing complexity, making informed decisions, and ensuring that 500+ talented engineers are collectively moving in the right direction.
Managing a large engineering organization? PanDev Metrics — enterprise engineering intelligence with on-premise deployment, LDAP/SSO, multi-tenancy, and support for 500+ developer teams.