Terraform Adoption: Metrics for Infrastructure Teams

The team adopted Terraform 18 months ago. Deploys are slower than the old click-ops setup, reviews take longer, and three of your best engineers now spend a full day per week on Terraform plan output. Senior leadership asks whether the migration was worth it, and nobody has a clean answer. The honest one is: you never defined what "worth it" looks like in metrics. HashiCorp's 2024 State of Cloud Strategy reported that 76% of enterprises adopted IaC, but only 31% measured its outcomes against pre-adoption baselines. The CNCF's 2023 Annual Survey found a similar gap for infrastructure-as-code tooling generally.
This article is a measurement framework for infrastructure teams already using Terraform, OpenTofu, or Pulumi. It doesn't debate whether IaC is worthwhile — that ship sailed. It defines six metrics that show whether your adoption is healthy or decaying, plus the benchmark ranges from 37 companies in our dataset that run Terraform in production.
{/* truncate */}
The problem
Most IaC "success" claims are based on end states (we use modules now!) rather than trajectories. Trajectory matters more. A team with 200 modules and a 15% reuse rate is worse off than a team with 40 modules and an 80% reuse rate, even though the first looks more "adopted" on a slide.
The failure mode we see most: Terraform sprawl without consolidation. After 18-24 months, teams accumulate hundreds of .tf files, dozens of loosely-shared modules, and an apply-time that creeps past 20 minutes. At that point the IaC is slowing the team instead of speeding it. Thoughtworks' Technology Radar has flagged "Terraform sprawl" as an anti-pattern since 2022.
The 6 metrics to track
Metric 1 — Module reuse rate
Percent of resources created inside a shared module vs. inline in a root config. Low reuse = every team is reinventing aws_s3_bucket with slightly different tags and lifecycles.
Target: 65-80% on infrastructure older than 12 months. Red flag: below 40% after 18 months of adoption.
How to measure: count resource blocks, check if each is inside a module. path or at root. Scriptable in ~30 lines of Terraform parser.
Metric 2 — Plan-to-apply ratio
Ratio of terraform plan runs to terraform apply runs in a given week. Runs that never apply = reviewer fatigue, over-cautious processes, or plan-timeout issues.
Healthy range: 3:1 to 5:1 (you plan more than you apply, that's fine). Red flag: above 10:1 (plans are noise, not signal) or below 1.5:1 (you're applying too much without review).
Metric 3 — Apply duration (p50 + p95)
Median and tail latency of a production apply. This is your infrastructure deploy frequency — DORA's deployment frequency metric applied to IaC. An apply that takes 45 minutes turns into a team policy to batch changes, which is how you end up with risky Friday afternoon changes.
| Team size | Healthy p50 | Healthy p95 | Red flag p95 |
|---|---|---|---|
| <10 engineers on infra | 2-5 min | 10 min | 30+ min |
| 10-30 engineers | 5-10 min | 20 min | 45+ min |
| 30+ engineers | 5-15 min | 25 min | 60+ min |
Metric 4 — Plan-failure rate
Share of plans that fail to run (state lock, provider errors, drift). This is IaC's equivalent of change failure rate. A small constant rate (2-5%) is healthy. A climbing trend signals infrastructure that has drifted from code.
Our data across 37 Terraform-using companies:
| Adoption stage | Median plan failure rate | 90th percentile |
|---|---|---|
| First 6 months | 8.2% | 18% |
| 6-18 months | 4.1% | 11% |
| 18+ months (mature) | 2.7% | 7% |
| 18+ months (sprawl) | 9.4% | 22% |
The "sprawl" segment is the unpleasant one: teams at 18+ months who got worse, not better. Cause is almost always the same — modules multiplied faster than they were consolidated.
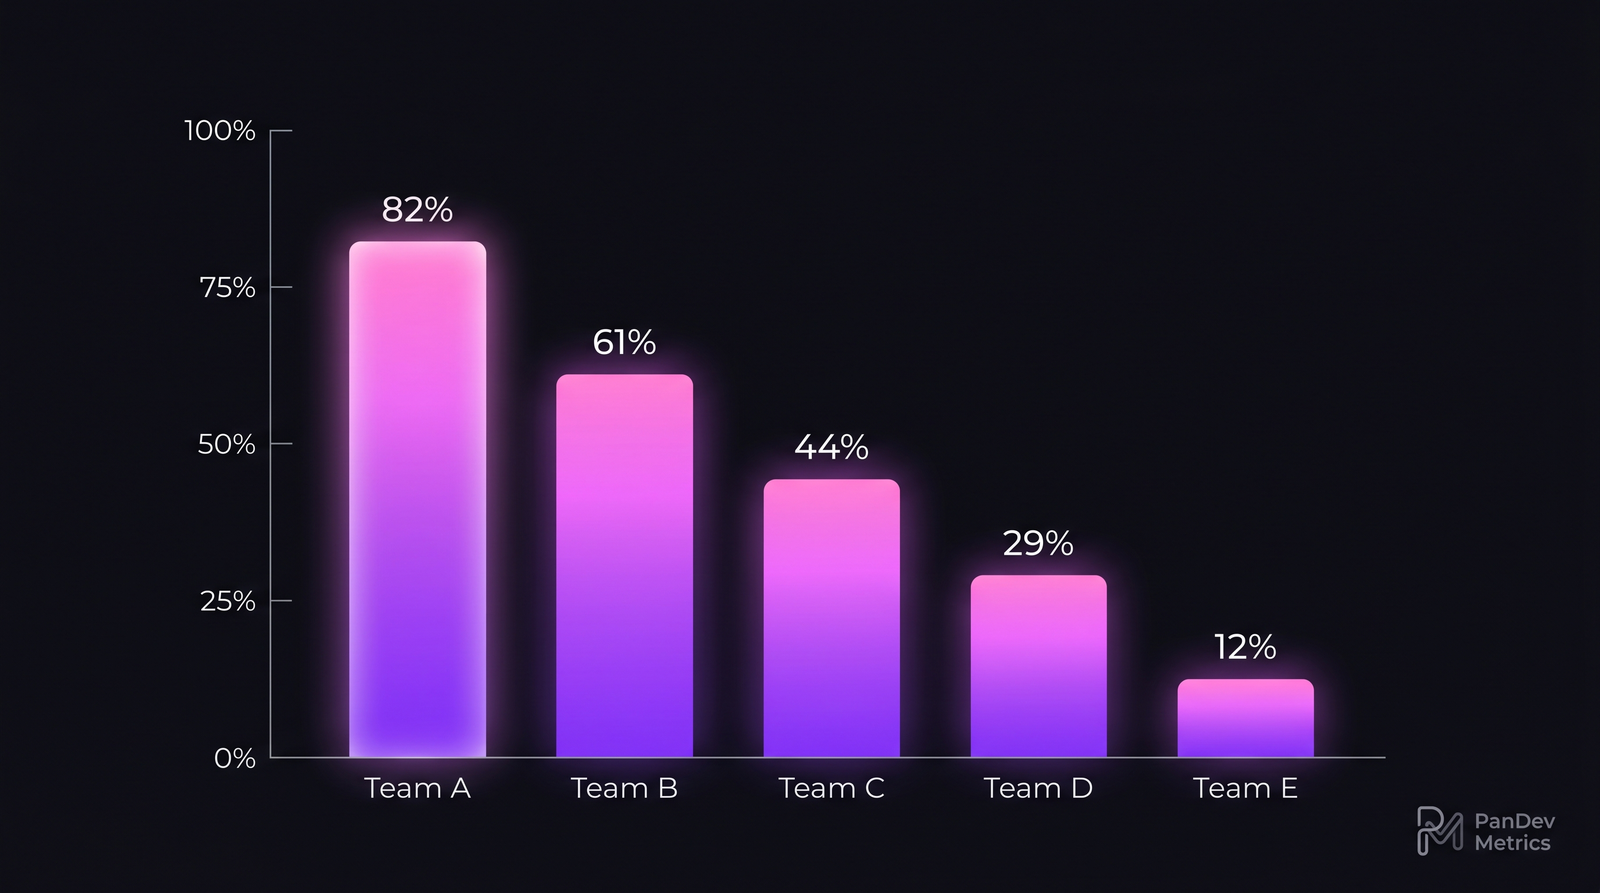 Module reuse rate separates healthy Terraform adoption from sprawl. A team at 12% is not benefiting from IaC — they're writing verbose boilerplate in HCL instead of a real language.
Metric 5 — Drift detection cadence
How often you scan production for state drift (terraform plan with no intended changes, detecting unexpected diffs). Teams with no drift detection discover infra reality during an incident.
Healthy: daily drift scan, with unexpected diffs alerted to the owning team. Acceptable: weekly. Red flag: ad-hoc / on-demand only.
Drift scans are the feedback loop that keeps Terraform honest. Without them, someone made a console change on Tuesday and the code lies about prod until Friday's release breaks.
Metric 6 — Engineer time per infra task
This is where IDE telemetry becomes useful. Track time spent inside .tf, .hcl, .tfvars files — our language-distribution reporting breaks this out automatically. If IaC work grew from 8% of infrastructure team time (pre-adoption) to 45% (year 1) to 22% (year 3), you have a healthy S-curve. If it stayed at 45% or climbed past it, you're in sprawl.
| Phase | Expected infra-team time on IaC |
|---|---|
| Pre-adoption (click ops) | <5% |
| Adoption year 1 | 30-50% |
| Adoption year 2 | 20-30% |
| Steady state (mature) | 10-20% |
The steady-state number matters. IaC adoption that never gets back below 30% is not paying off. Either the codebase is too complex for the team's scale, or modules never consolidated.
Common adoption mistakes
| Mistake | Why it hurts | Fix |
|---|---|---|
| One giant state file | Apply time explodes, one change blocks all | Split by environment + service, use remote state + data sources |
| Copy-paste modules instead of sharing | Reuse rate drops, security hardening never propagates | Mandate shared-module registry, block new resource blocks outside modules in CI |
| No drift detection | Prod reality diverges from code, next deploy breaks | Daily drift scan, alert on diffs |
terraform apply from local machines | No audit trail, credentials sprawl | Mandate CI/CD apply with OIDC, not long-lived keys |
| Versionless modules | Breaking changes land silently in downstream consumers | Require version = pin in all module calls |
How to measure success with PanDev Metrics
Infrastructure engineers show up differently in our IDE-heartbeat data than feature engineers. Their language distribution is HCL-heavy, their active coding time is lower (plans take time), and their context-switching is often triggered by alerts rather than task assignments. PanDev Metrics' language-distribution view separates HCL / YAML / Starlark time from Python / Go / Terraform-module-Go so you can see the actual IaC share of engineer effort.
Three views that matter:
- HCL time as % of infrastructure team time — the Metric 6 signal above.
- Context switching per infra engineer — high values correlate with drift-driven firefighting.
- Cost per infrastructure change — using our cost-per-feature view with infrastructure projects to get dollar values on IaC engineer time.
The checklist
- Module reuse rate measured monthly, target ≥65% by month 18
- Plan-to-apply ratio visible to team leads, alert on >10:1
- Apply p50 and p95 tracked per environment
- Plan failure rate trended; investigate any climb after month 12
- Drift detection runs daily, unexpected diffs are incidents
- Infra-team HCL time is bounded; climbing values trigger consolidation sprint
- New modules require version pin, README, and an owner
- Apply runs from CI only, no local creds
When Terraform is the wrong tool
This framework assumes Terraform (or OpenTofu, same shape) is right for the team. It isn't always. Cases where you should reconsider:
- Single-cloud, mostly serverless, small team (<5 engineers): AWS CDK or Pulumi in a real language often wins. Terraform's value scales with multi-cloud and module reuse across teams.
- Rapidly-evolving prototype phase: click ops isn't a sin at <3 months. Premature IaC burns weeks on abstractions that get deleted.
- Kubernetes-only estate: ArgoCD + Helm + Kustomize often covers 90% of what a team would use Terraform for. Adding Terraform on top adds a second source of truth.
The contrarian point: Terraform adoption is often sold as a monotonic win. It's not. Teams in our dataset that adopted Terraform and stayed at low module-reuse for 2+ years produced more infrastructure bugs than the teams that never adopted. The tool without the module discipline is a worse outcome than the click-ops baseline.