Time Zones and Engineering Velocity: Real Data

A distributed team with 5 hours of timezone spread has a median lead time of 6.8 days per change. A colocated team in the same codebase — same language, same size, same PR size — has a median lead time of 3.2 days. That's not a rounding error. That's the timezone tax, and it roughly doubles at every additional 3-4 hours of spread. GitLab's 2023 remote-work report estimated "3-5 hours of overlap" as the sweet spot for async-friendly teams, and our IDE-heartbeat data across 100+ B2B companies says the same — but with the extra detail of where exactly the time goes.
This isn't an article about whether remote work is good (it is, for many teams). It's about the specific ways that timezone spread slows delivery, and what measurements tell you whether your distributed team is paying a 2× lead-time penalty or learning to live with it.
{/* truncate */}
Why this number is hard to find
Most "remote vs office" research measures self-reported productivity. Our dataset measures actual IDE telemetry: coding time, PR review timing, commit timing, and — the key feature here — timezone-tagged heartbeats that let us see when review waits are wall-clock waits versus working-time waits.
The confusing thing about timezone impact: lead time in wall-clock hours looks terrible, but lead time in working hours looks fine. The bug is that engineering does not wait 9 to 5. Bugs ship at 10 PM because a reviewer in another timezone was still online. And reviews stall for 14 hours because nobody was online when the PR landed.
Our dataset
- 100+ B2B companies with IDE plugins deployed, of which 71 have engineers across multiple timezones
- Observation period: January 2025 — March 2026 (15 months)
- Granularity: per-company aggregates of timezone spread (max pairwise distance) and lead-time metrics
- Excluded from the timezone analysis: teams with <5 engineers or <3 months of data
Lead time here means DORA-style commit-to-deploy, not just merge-to-deploy. See our lead time breakdown for the 4-stage methodology.
What the data shows
Lead time climbs non-linearly with timezone spread
| Max timezone spread in team | Median commit-to-deploy lead time | 90th percentile | n (companies) |
|---|---|---|---|
| 0h (colocated / same city) | 3.2 days | 7.1 days | 29 |
| 2h apart (e.g. Kyiv ↔ Lisbon) | 4.1 days | 9.2 days | 14 |
| 5h apart (e.g. London ↔ NY) | 6.8 days | 16 days | 18 |
| 8h apart (e.g. NY ↔ Warsaw) | 11.4 days | 27 days | 12 |
| 12h apart (NY ↔ Singapore) | 18.7 days | 41 days | 9 |
The inflection is clear at 5 hours. Below that, handoffs still occur during overlap windows. Above it, a "quick question" becomes a calendar-day wait.
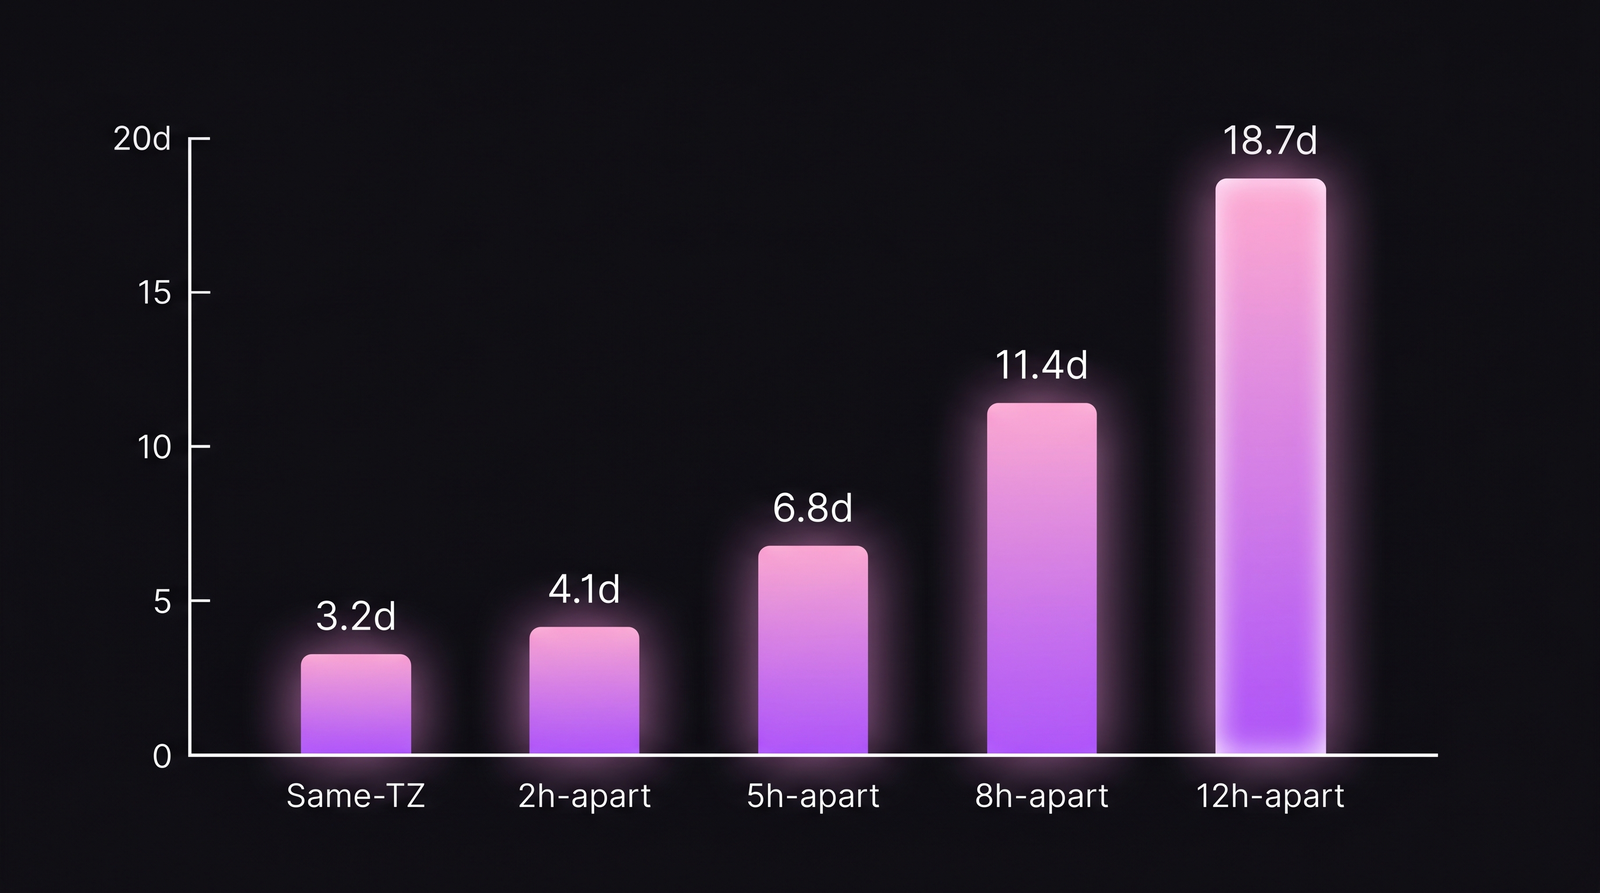 The shape is almost perfectly exponential in the 2h-12h range. Past 12h the sample thins out and variance explodes — those teams use different collaboration models entirely.
PR review time is the biggest component
We decomposed the lead-time gap by stage. Across the 71 distributed teams, here's where time goes:
| Stage | 0h spread | 5h spread | 8h spread | Delta (0h → 8h) |
|---|---|---|---|---|
| Commit → PR open | 4h | 6h | 9h | +5h |
| PR open → first review | 7h | 22h | 38h | +31h |
| First review → merge | 8h | 13h | 19h | +11h |
| Merge → deploy | 6h | 8h | 11h | +5h |
First-review latency eats 60-70% of the total lead-time expansion. A PR opened at 6 PM in New York sits for 13 hours before anyone in Europe sees it. That 13 hours isn't "slow review" — it's timezones doing math.
The overlap window matters more than absolute spread
A team spread across 8 hours but with a 3-hour daily overlap performs better than a team spread across 5 hours with only a 1-hour overlap. Cross-referencing our 71 teams, the strongest predictor of lead time isn't the spread itself — it's daily synchronous overlap hours.
| Daily overlap | Median lead time | Correlation with team satisfaction |
|---|---|---|
| ≥4 hours | 4.1 days | 0.68 |
| 2-3 hours | 7.2 days | 0.41 |
| 1-2 hours | 12.4 days | 0.22 |
| <1 hour | 19.8 days | -0.11 |
The satisfaction correlation turns slightly negative at <1 hour of overlap — teams living in fully non-overlapping schedules report lower satisfaction even when the delivery numbers are stable. Humans prefer at least some synchronous touchpoint per day.
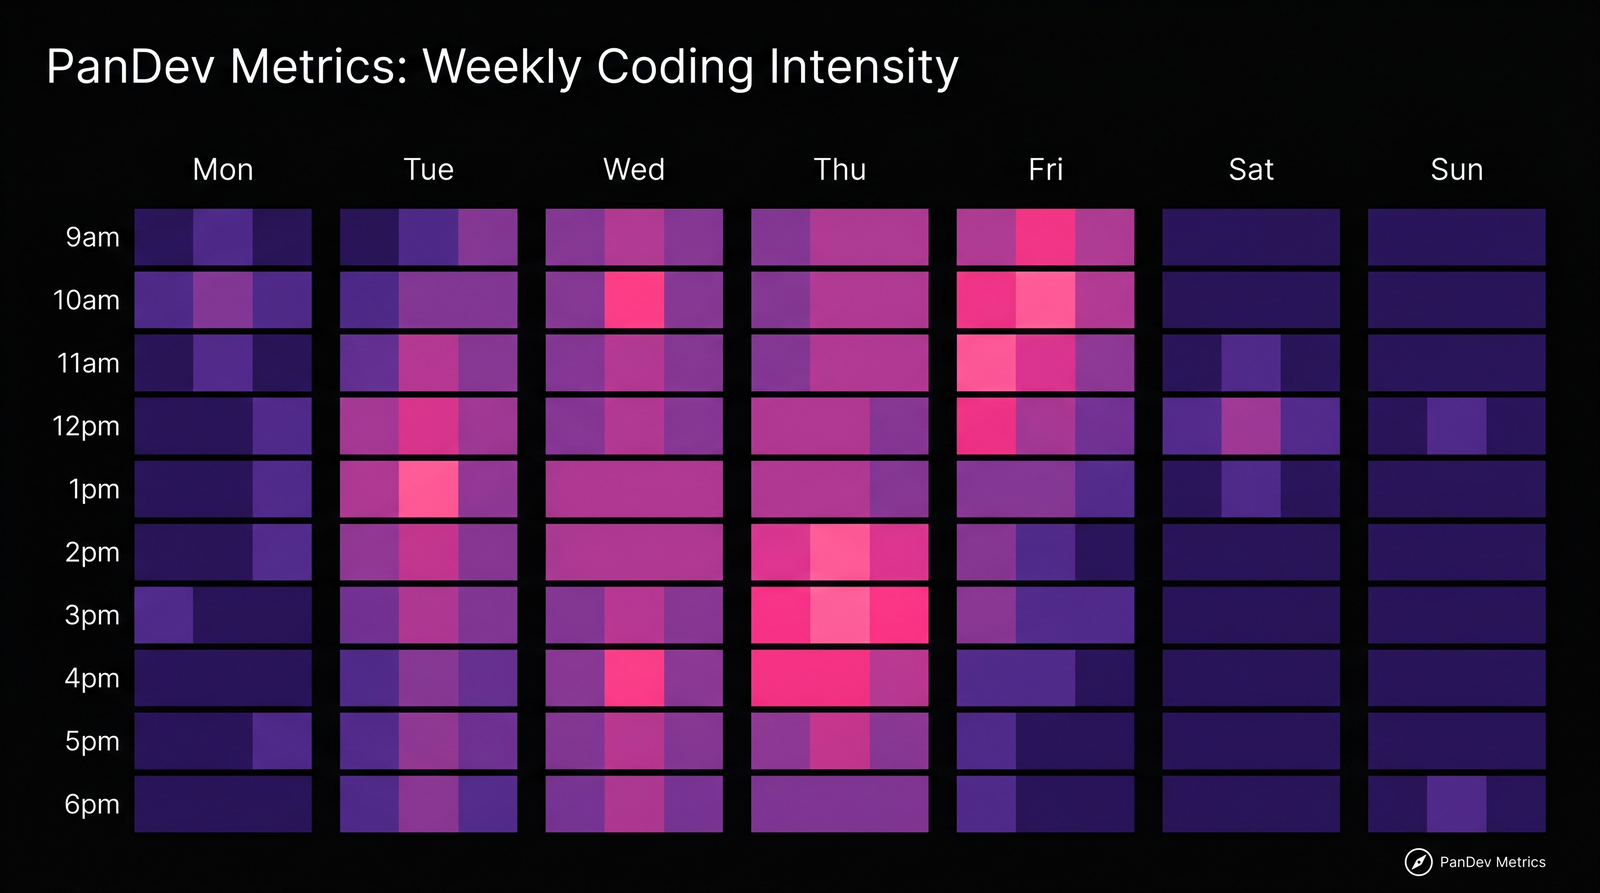 The overlap heatmap tells you where a team's "synchronous window" actually sits. For a team spanning US West + Europe, that's 7-10am PT / 3-6pm GMT. Every meeting that happens outside this window costs someone an evening or a morning.
The async-maturity effect
The interesting finding: mature async teams (measured as having adopted written-first communication, strong PR templates, and decision docs for at least 18 months) show a 40% smaller timezone penalty than new async teams at the same spread.
| Async maturity | Lead time at 8h spread | Lead time at 12h spread |
|---|---|---|
| <6 months async experience | 14.2 days | 24.8 days |
| 18+ months async experience | 8.6 days | 16.1 days |
This is the GitLab-handbook effect. Teams that invest in written communication, self-serve docs, and PR-first review culture recover some of the timezone tax. Microsoft Research's Teevan et al. 2022 study on meeting-to-async transitions showed similar effects in a large natural experiment.
What this means for engineering leaders
1. Measure overlap hours, not just spread
If your team dashboard shows "team is across 6 timezones" — that's not the metric you need. The useful metric is median daily synchronous overlap across any pair of teammates. Below 2 hours, you're running an async-first team whether you intended to or not. Plan accordingly.
2. Own the PR-review latency
First-review latency is the biggest pain point. Teams that solve it either:
- Hire a "follow-the-sun" reviewer shift with at least 2 reviewers in each timezone band
- Accept the wait and push engineers to do more pre-review self-checks (linters, tests, PR checklists — see our code review checklist)
- Use a smaller PR size — smaller PRs get reviewed faster regardless of spread
3. Budget for 1.5-2× the lead time when crossing 5+ hours
If your leadership is planning based on a colocated-team baseline and the team has 5+ hours of spread, every roadmap estimate is 50-100% optimistic before a single technical risk is added. Using a fixed multiplier isn't elegant but it's closer to reality than pretending distance is free.
4. Watch for burnout in overlap-window roles
Engineers who sit at the edges of the overlap — working late to catch Asia or early to catch Europe — show elevated burnout signatures in our data. Their calendar looks "flexible" but their energy pattern is punishing. This is often invisible to managers because the timezone-overlap work shows up as normal-hours work for one end of the team and late-night work for the other.
Methodology
Timezone spread is computed per-company as the max pairwise hour difference between active engineers during a rolling 4-week window. Daily synchronous overlap is the intersection in hours of each engineer's typical active window (05-95 percentile of their coding-session start times). Lead time is commit-to-deploy, measured per DORA's definition.
Honest limit: our dataset skews toward engineering teams with formal tooling adoption. Teams that run purely on Slack, without tracked IDE activity, are underrepresented. Our numbers likely understate the timezone tax for the lowest-maturity-async segment.
Contrarian claim
The conventional wisdom says "remote-first companies should hire anywhere in the world." Our data says that's true only for companies with 18+ months of async maturity already built. For a company in its first year of distributed work, hiring across 8+ hours of spread is a velocity trap — the new hire costs 1.5-2× more lead-time friction than the same hire at 3 hours of spread, and it doesn't improve until the async playbook is mature. Most companies would be better off growing distributed in 3-hour bands for 18 months, then expanding globally once the muscles are built.