Top Expenses Report: Monthly Reviews That End in Decisions

The standing monthly engineering cost review at the 80-person org we worked with in March 2026 ran 90 minutes. Six dashboards. Four department leads each defending their numbers. The output: a Slack message saying "let's dig in next month." Same message in February. Same in January. The dashboards were excellent. The decisions were zero.
The problem is not data scarcity. Asana's 2024 Anatomy of Work report found knowledge workers spend 58% of the day on "work about work," meetings, status updates, and dashboard reviews, and that the modal review meeting produces no concrete next action. Engineering cost reviews are a textbook case. Too many numbers, no forcing function for a decision.
{/* truncate */}
Why the standard review fails
A typical monthly review opens a cost dashboard with twelve charts. Total spend by month. By department. By project. By engineer. By task type. The reviewers stare. Someone asks "anything stand out?" Someone else points at a peak. The conversation drifts to "we should look at that more closely." Forty minutes in, the meeting is one-third interpretation, two-thirds collective hedging.
This is not a discipline problem. It is an attention problem. Andy Grove called this out in High Output Management forty years ago: managerial reviews fail when leaders aim for "comprehensive understanding" instead of "the one thing that requires my decision." HBR's research on monthly business reviews consistently finds the same. The most effective reviews are short, structured around outliers, and force a yes/no decision per outlier.
Engineering cost has a property that makes the outlier approach uniquely well-suited: costs distribute on a long tail. In our March 2026 dataset for a 100-engineer org, the top single project consumed 9.6% of total spend. The top single task consumed 0.7%. The top single engineer consumed 2.1%. Outliers are large enough to matter, rare enough to discuss in 30 seconds.
That is the entire premise of what we now call the TOP-1 review.
The TOP-1 review pattern: four questions, four decisions
Replace the 90-minute dashboard tour with four questions. One question per cost dimension. The expected output for each: a name, a number, a reason, and a decision.
| Question | Data to look at | Decision unlocked |
|---|---|---|
| Most expensive project last month, why? | Project total cost, % of org spend, change vs prior period | Strategic priority alignment (or de-funding) |
| Most expensive task / ticket, why? | Issue cost, hours logged, distinct contributors | Operational ownership and scope discipline |
| Most expensive employee, why? | Per-engineer FTE-equivalent cost, hour distribution | Utilization correction (burnout or under-load) |
| Most expensive team, why? | Team total cost, % of org, output vs investment | Investment-vs-return reset, chargeback decision |
Four questions. Four answers. Four decisions. Even if three of the four answers are "no action, this was correctly prioritized," that is still three explicit alignments per month, instead of the usual zero.
PanDev's POST /finance/top-expenses endpoint returns exactly this: top-1 across project, task, employee, and team for the last 30 days, in a single response. Each entry carries the name, cost, percentage of total org spend, percentage change vs the prior period, and a UP/DOWN trend hint. The API was built specifically for this review pattern, after watching too many customers spend two hours assembling the same four numbers from separate dashboards.
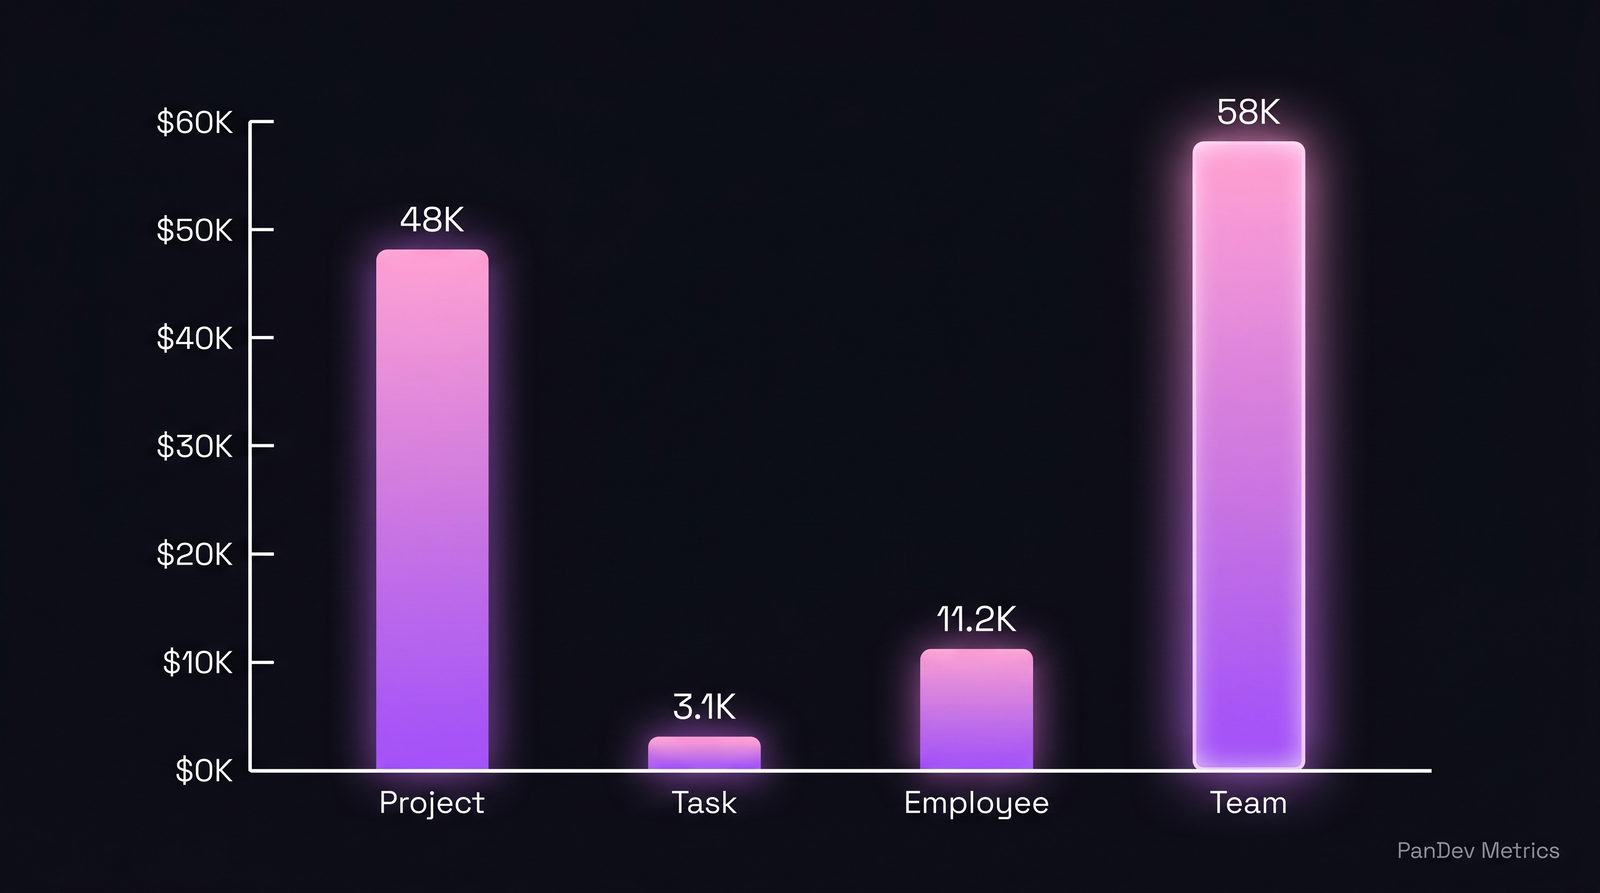
A worked example: 80-person org, March 2026
Real review, anonymized. Pulled from one customer's actual /finance/top-expenses payload combined with /finance/summary for macro context (total org spend $487K, 11 departments).
 Each TOP-1 dimension on the same monthly snapshot. "Team" can be larger than "project" because a team works on multiple projects in parallel.
Question 1. Most expensive project: multi-tenant-sso at $48K
That is 9.9% of the org's monthly spend, and 3.2x the average project. The trend was UP 38% vs February.
Why? Enterprise deal-blocker. Two prospects had named SSO as a contract prerequisite. The CFO and VP Eng had explicitly chosen this prioritization in the Q1 planning round. The TOP-1 number confirmed the plan was being executed. Decision: no action, keep prioritization through April, re-evaluate when prospect contracts close.
This is the most common TOP-1 outcome and the most undervalued one. "We are spending the money where we said we would" is a finding. It just rarely makes it onto a slide.
Question 2. Most expensive task: PROJ-1281 date-format bug at $3.1K
49 hours logged. Six distinct engineers touched the ticket across three weeks. Average task cost across the org: $190.
Why so expensive? Nobody owned it. It was a customer-reported timezone display bug, picked up briefly by three engineers on three separate squads, each unable to reproduce locally, each handing it back to the queue. The actual fix was 90 minutes of work, when the seventh engineer finally reproduced it on a Windows machine. The other 47.5 hours were context-switching tax. We covered the mechanics of this in detail in Cost per Jira Ticket.
Decision: ownership matrix update. Every customer-reported bug gets assigned to a single accountable squad within 24 hours, with re-routing requiring engineering manager approval. That decision came out of a 90-second discussion. It would never have surfaced from a project-level dashboard.
Question 3. Most expensive employee: senior backend lead at $11.2K direct cost
Direct cost is loaded hourly rate × hours logged. The org average for the month was $4.2K per engineer. This person logged 90 hours of FTE-equivalent activity, well into what we flag as the burnout red zone (>85h/month sustained).
Why? Pre-launch crunch on the SSO project. They were the only engineer with deep context on the legacy auth provider being deprecated. Decision: hire one mid-level backend support engineer in April, redistribute three of the senior's recurring on-call slots to two existing engineers immediately. UC Irvine's Gloria Mark has documented the cognitive cost of sustained overload. 90-hour weeks for a quarter compound into multi-month productivity drops, not the proportional output the hours suggest.
If the TOP-1-employee question had not been on the agenda, this would have surfaced in a quarterly burnout retrospective. By that point, the engineer would have left.
Question 4. Most expensive team: Platform team at $58K
12% of total org cost, largest of any team for five consecutive months. The Platform team builds shared infrastructure (auth-service, observability stack, CI runners) that every product team consumes.
Why? They are mid-build on the new auth-service foundation that the SSO project depends on. The investment was deliberate. The question becomes: are the consuming teams paying for what they consume?
Decision: introduce internal chargeback model from Q3. Platform team's costs allocate proportionally to consuming product teams based on auth-service request volume, observability log volume, and CI minutes. This was a 4-minute discussion that had been postponed for six months because nobody had the right number to anchor it.
The full review summary
| Dimension | TOP-1 entry | Cost | % of org | Trend | Decision |
|---|---|---|---|---|---|
| Project | multi-tenant-sso | $48,000 | 9.9% | UP 38% | Continue, aligned with Q1 plan |
| Task | PROJ-1281 (date format bug) | $3,140 | 0.6% | NEW | Ownership matrix update |
| Employee | Senior backend lead | $11,200 | 2.3% | UP 22% | Hire support, redistribute load |
| Team | Platform | $58,400 | 12.0% | FLAT | Chargeback model from Q3 |
Total review time: 31 minutes. Three concrete decisions. One explicit confirmation that the largest line item was correctly funded. Zero "let's circle back next month."
What you need to make this work
Three preconditions, in order of difficulty:
-
Cost attribution per dimension that you trust. Project cost is easy. Task cost requires that engineers' time is attributable to a Jira issue (we covered the mechanics in the cost-per-task article). Employee cost requires loaded-rate × actual-hours, not budgeted FTE. Team cost requires that you have a stable team-membership map for the period.
-
A standing 30-minute monthly slot, not a 60-minute one. The time-box is the forcing function. With 30 minutes, every question gets roughly 7 minutes, which is enough for a name, a number, a reason, and a decision. Anything longer becomes the dashboard tour you were trying to escape.
-
A shared definition of what "TOP-1" means. Most expensive by what: total cost, cost per output, cost growth? We standardize on absolute total cost for the month, because outliers in absolute terms are the ones large enough to fund a decision. Growth-based TOP-1 is a useful secondary view but creates noise on small absolute lines.
The companion post on the cost heatmap pattern covers the visualization layer once you have the underlying attribution. The CFO-side framing for these conversations lives in our CFO's Guide to Engineering Metrics.
When TOP-1 doesn't fit
This is the honest section.
TOP-1 surfaces outliers. It does not catch systemic patterns. If the actual problem in your organization is 60 mediocre tickets eating 40% of capacity, where no single ticket is expensive but the long tail is enormous, TOP-1 will look fine while the problem worsens. The right framing for that case is variance analysis on the median ticket cost over time, plus capacity-allocation review.
Use TOP-1 as the standing monthly diagnostic. Pair it with quarterly budget variance analysis for systemic issues, and per-investment ROI checks via the framing in the engineering ROI methods piece. One pattern doesn't catch everything. TOP-1 catches the ten things you would otherwise miss until they hurt.
The contrarian closer
Most cost-review failures get blamed on the wrong thing. People say "we don't have the right data" or "the dashboards aren't good enough." The data is fine. The dashboards are fine. What's missing is the willingness to make the meeting smaller.
Cut the next monthly cost review to four questions. Time-box it to 30 minutes. Refuse to answer any question that wasn't on the list. The first month will feel uncomfortably narrow. By month three, your finance team will fight you to keep it that way.