Transparency as Competitive Advantage: Why Clients Choose Companies With Metrics

The Deloitte Global Outsourcing Survey found that lack of transparency is the primary driver of client dissatisfaction in outsourcing relationships. Two companies pitch the same client. Same tech stack, similar rates, comparable portfolios. One says: "We deliver quality work on time." The other says: "Here's a live dashboard showing exactly what your developers are doing right now." Which one wins?
In 2026, the answer is obvious. Transparency isn't a nice-to-have — it's the differentiator.
{/* truncate */}
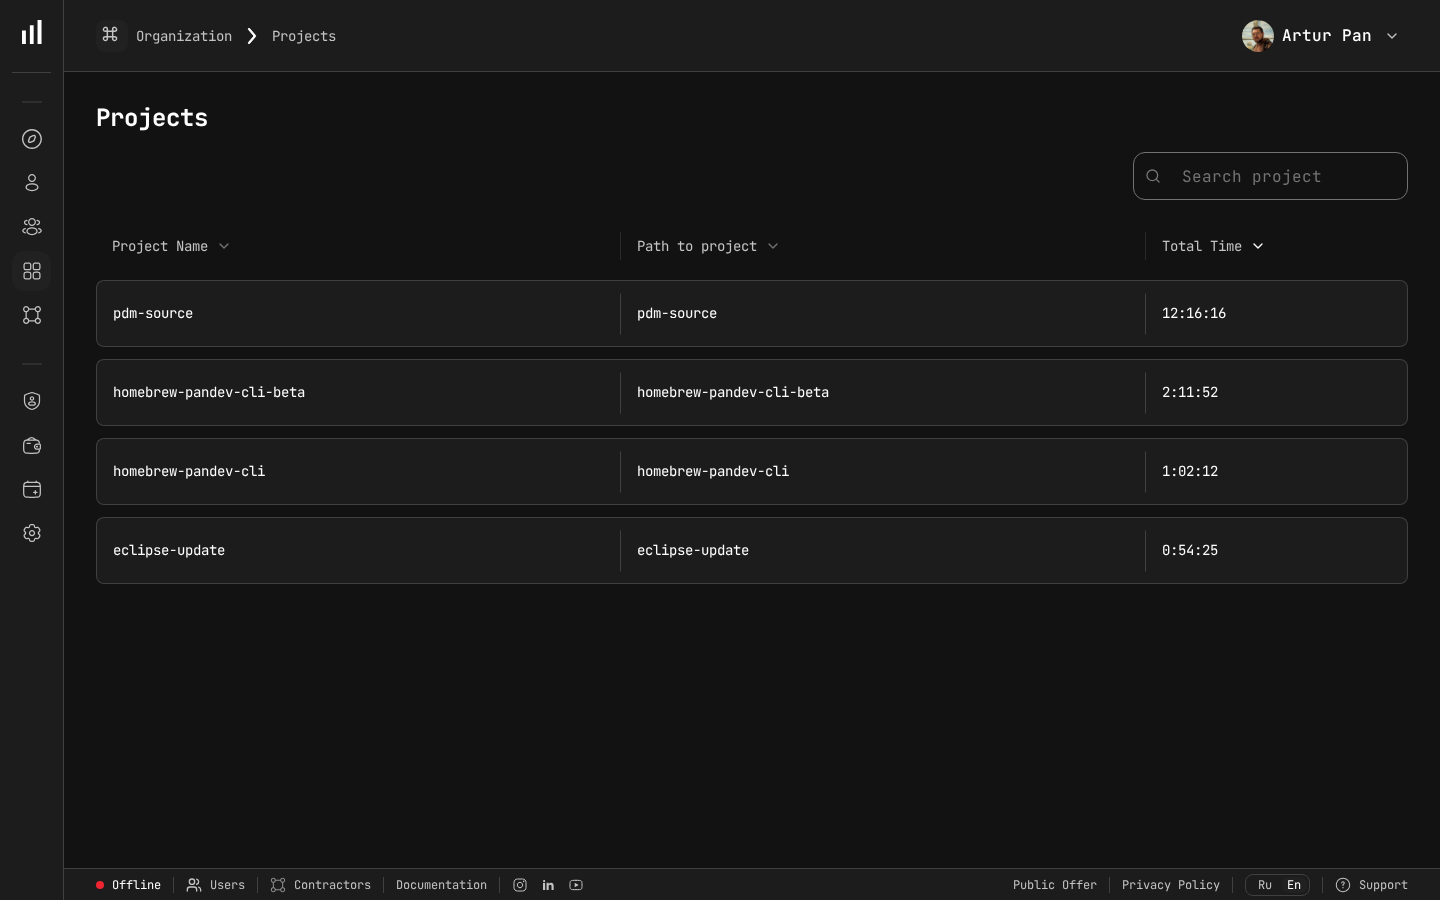
Project-level time tracking that clients can access for full transparency.
The Outsourcing Trust Deficit
Outsourcing has a trust problem baked into its business model. You're asking a company to pay $40–$100 per hour for developers they can't see, working in an office they'll never visit, on code they might not fully understand.
Every outsourcing CEO knows the unspoken client fears:
- "Are the developers actually working full-time on my project?"
- "Am I paying senior rates for a junior developer?"
- "Why did this feature take 3 weeks when it seemed like a 3-day task?"
- "Is my project their priority, or am I subsidizing someone else's project?"
These fears don't go away with a good first impression. They simmer. And when deliverables slow down or a bug appears in production, those fears become accusations.
The traditional outsourcing response is more communication: weekly status calls, detailed Jira updates, PM reports. But communication is still a narrative — someone telling the client a story. What clients actually want is evidence.
Why Metrics Beat Promises
There's a fundamental difference between promising transparency and delivering it:
| Promise-Based Transparency | Metrics-Based Transparency |
|---|---|
| "Your team is working hard" | Activity dashboard shows 7.2 hours of IDE time today |
| "We're on track for the sprint" | Burn-down correlated with actual coding hours |
| "The developer is dedicated to your project" | Project-level breakdown: 142 hours on your project, 18 on internal tasks |
| "Here's our monthly report" | Client has 24/7 access to real-time data |
The first column requires the client to trust you. The second column requires them to trust math.
The psychology of verifiable data
When a client can verify claims independently, something powerful happens: they stop verifying. This is counterintuitive but well-documented in behavioral economics research on trust and verification. When people know they can check, they feel less need to actually check.
Give a client a real-time dashboard, and after the first month of spot-checking, most will rarely log in. But take that dashboard away, and the anxiety returns immediately.
The dashboard isn't about monitoring — it's about peace of mind.
Five Ways Transparency Wins Deals
1. Shorter Sales Cycles
The biggest friction in outsourcing sales is trust-building. Prospects want references, trial periods, and proof-of-concepts — all because they can't verify what happens after they sign.
When your sales deck includes a live demo of your activity tracking system, you compress weeks of trust-building into a single meeting. The prospect thinks: "If they're this transparent before the deal, they'll be transparent after."
Companies using engineering metrics in their sales process report significantly faster deal closures. The reason is simple: you're removing the biggest objection (lack of visibility) before the prospect even raises it.
2. Higher Win Rates Against Competitors
In competitive bids, transparency is a concrete differentiator that's hard to copy overnight. Your competitor can match your hourly rate. They can claim similar expertise. But they can't instantly replicate a mature metrics infrastructure.
When a prospect is comparing three vendors and only one offers real-time activity dashboards, automated reports, and per-project cost tracking — that vendor has an unfair advantage.
3. Premium Pricing Justified
Transparency supports premium pricing because it eliminates the value perception gap. When a client can see that their developer coded 6.5 hours today across 12 files in 3 different services, the $85/hour rate feels justified. Without that visibility, the same rate feels like a gamble.
Companies that implement comprehensive metrics often find they can price higher than the market average without losing deals. The transparency premium is real.
4. Faster Ramp-Up on New Engagements
When a new client engagement starts, there's always an awkward period: the client is watching closely, the team is still ramping up, and deliverables are sparse. This is when most trust damage happens.
With activity metrics, you can show the client that developers are actively working from day one — even before the first deliverable lands. "Your developers logged 35 hours of coding in the first week, primarily in the authentication service and database layer." That single sentence buys you weeks of patience.
5. Easier Upselling and Expansion
Expanding an existing engagement — adding more developers, extending the contract, starting new workstreams — requires the client to feel good about the current arrangement. If they have lingering doubts about value, they won't expand; they'll look for alternatives.
Metrics make the business case for expansion tangible. "Your current team of 3 developers delivered an average of 450 coding hours per month across 6 microservices. To hit the Q3 roadmap, we recommend adding 2 more developers to maintain velocity."
Building Your Transparency Stack
A credible transparency offering has four layers:
Layer 1: Activity Tracking
The foundation. You need non-invasive, continuous tracking of developer activity. IDE heartbeat-based solutions like PanDev Metrics capture when developers are coding, which projects they're working on, and how many active hours they log — without screenshots or invasive monitoring.
Key features to look for:
- Per-project time breakdown
- Support for all major IDEs
- Minimal developer friction (install and forget)
- Activity data, not surveillance data
Layer 2: Cost Intelligence
Raw activity hours are useful, but clients think in dollars, not hours. Layer cost intelligence on top of activity tracking:
- Hourly rate configuration per developer or role
- Per-project cost calculation — how much the client is actually spending per project
- Cost trend analysis — is the project getting more expensive or more efficient over time?
- Budget tracking — how much of the monthly/quarterly budget has been consumed?
PanDev Metrics handles this natively — you set hourly rates per employee, and the platform calculates costs per project automatically based on real tracked hours.
Layer 3: Reporting
Data is only useful if it's presentable. You need reporting that serves two audiences:
For internal use (PMs, Engineering Managers):
- Real-time dashboards with drill-down capability
- Team-level and individual-level views
- Multi-project comparisons
For clients:
- Clean, one-page monthly summaries
- Excel exports they can forward to their finance team
- Visual charts that non-technical stakeholders can understand
The one-click Excel report export is particularly important — clients often need to attach activity data to internal procurement or accounting workflows.
Layer 4: Access Control
Some clients want dashboard access. Others just want the monthly report. Your platform should support both:
- Client dashboards with read-only access to their projects only
- Role-based permissions so the client's CTO sees different data than their finance director
- Data isolation ensuring one client can never see another client's data
Case Study: The Transparency Pivot
Consider an outsourcing company with 60 developers and a client retention challenge. Their annual churn rate was around 25% — one in four clients would leave each year, usually citing "unclear value for money" or "communication issues."
Their turnaround strategy had three pillars:
Step 1: Instrument everything. Every developer installed IDE tracking plugins. Every project was mapped in the system. Hourly rates were configured per developer.
Step 2: Lead with data. Monthly client reports shifted from narrative ("the team worked on features X and Y") to data-driven ("the team logged 640 coding hours across 4 developers, primarily in the payment service, at a total cost of $48,000"). Trend charts showed month-over-month patterns.
Step 3: Make it a sales asset. The sales team started demoing the tracking dashboard in prospect meetings. The pitch became: "You'll never wonder what you're paying for."
The results after 12 months of this approach were transformative:
- Client churn dropped significantly
- Average contract value increased — clients were willing to scale up because they felt confident
- New client acquisition accelerated
- The company repositioned from "affordable outsourcing" to "transparent engineering partner" and raised rates accordingly
The Transparency Maturity Model
Not every company needs to jump to full transparency immediately. Here's a progressive approach:
Stage 1: Internal Visibility (Month 1)
Start by tracking activity internally. Get your PMs and engineering managers comfortable with the data. Identify any team issues before exposing them to clients.
Stage 2: Enhanced Reporting (Month 2-3)
Add activity summaries to your existing client reports. Don't change the format dramatically — just add a section with tracked hours and project breakdowns.
Stage 3: On-Demand Access (Month 4-6)
Offer interested clients read-only dashboard access. Start with your most trusted client relationships as pilots.
Stage 4: Transparency as Standard (Month 6+)
Make metrics a standard part of every engagement. Include it in contracts. Feature it in sales materials. Make it a core part of your brand identity.
Objections and How to Handle Them
"What if the data makes us look bad?"
Valid concern. What if a developer only shows 4 hours of IDE time on a day they billed 8?
First, remember that IDE time isn't total work time. Code reviews, architecture discussions, debugging without an IDE, client calls — these are legitimate work activities that aren't captured by editor tracking. Set this expectation clearly with clients.
Second, if there genuinely is a productivity issue, wouldn't you rather catch it yourself than have the client catch it through missed deadlines?
"Developers will resist tracking"
They'll resist screenshot monitoring. IDE heartbeat tracking is different — it's non-invasive, doesn't capture screen content, and runs silently. In practice, developers forget it's there after the first week. Frame it as billing protection, not surveillance.
"Our competitors don't do this — why should we?"
That's exactly the point. Your competitors don't do this, which means you can be the first. By the time they catch up, you'll have years of historical data and a reputation built on transparency.
"It's an additional cost"
Compare the cost of an engineering intelligence platform to the cost of losing a single client. For most outsourcing companies, one retained client per year pays for the tooling many times over.
"The main thing that stands out is their responsiveness and client orientation. If questions or bugs arise, the team reacts quickly. Our improvement requests are always heard and considered." — Rauan Bozabaev, CTO Chocofood (Forbes Kazakhstan, April 2026)
The Market Is Moving Toward Transparency
This isn't just our opinion. The outsourcing industry is shifting:
- Clients are more sophisticated. CTOs and VPs of Engineering who buy outsourcing services increasingly come from data-driven engineering cultures. They expect metrics.
- Remote work raised the bar. Post-pandemic, even in-house teams use activity tracking. Outsourced teams are held to at least the same standard.
- AI is changing the conversation. With AI coding assistants changing how developers work, clients want to understand what "productive time" actually means now.
IAOP (International Association of Outsourcing Professionals) data reinforces this shift: their recent analyses highlight "data-driven client management" as a defining characteristic of top-performing outsourcing providers. Companies that wait for transparency to become the industry standard will find themselves playing catch-up. Companies that lead with transparency today are building a moat.
Key Takeaways
- The biggest barrier to outsourcing growth is the trust deficit — and transparency is the cure
- Metrics-based transparency beats promise-based transparency because it's verifiable
- Transparency shortens sales cycles, increases win rates, justifies premium pricing, and improves retention
- A complete transparency stack includes activity tracking, cost intelligence, reporting, and access control
- Start internally, then progressively expose data to clients as you get comfortable
- The market is moving toward transparency — early movers build a lasting competitive advantage
Make transparency your edge. PanDev Metrics gives outsourcing companies real-time activity tracking, automated cost intelligence, and client-ready reports — everything you need to turn visibility into revenue.