Travel and Hospitality Engineering: Booking Platform Teams

A former Expedia engineer told me the quote that should be pinned above every travel-engineering team's desk: "We don't ship software — we ship promises about the future availability of physical objects." An Amadeus GDS query returns inventory that's simultaneously being consumed by 50+ competing distribution channels. Your code has to reconcile that in under 400ms or the user gives up.
Phocuswright's 2024 travel-technology report pegs the global online-travel industry at $1.06 trillion in gross bookings, with roughly 38% flowing through technology platforms that sit between travelers and suppliers. Amazon Web Services' travel-vertical analysis documents that peak-season traffic on booking engines routinely exceeds 15× the yearly baseline — more extreme than any other e-commerce vertical except Black Friday retail. Engineering teams built on "just scale horizontally" assumptions discover, on the first December, that search-cache misses on an unreachable GDS generate cascading failures 90 seconds deep.
{/* truncate */}
Why travel engineering is different
Most travel platforms look like any other booking marketplace from the outside. The engineering divergence starts at three places:
Legacy distribution protocols. The three main GDSs — Amadeus, Sabre, and Travelport — still power most airline, hotel, and car-rental availability. They run on protocols dating to the 1960s-80s (Type B messaging, EDIFACT, and newer NDC XML). A greenfield engineering team that expects REST+JSON everywhere will spend its first two years writing adapters. NDC (New Distribution Capability) is the IATA standard meant to modernize this, and as of 2026 it's partially adopted — Lufthansa Group pushed ~70% of indirect revenue through NDC, most US carriers are still under 20%.
Timezone math as a first-class concern. A flight departs JFK at 10pm local time on 2026-07-15, arrives at LHR at 10am local time on 2026-07-16. Is that an 11-hour flight or a 7-hour flight? It depends on DST, IATA three-letter airport codes to timezone mapping, and whether your PNR (Passenger Name Record) stores UTC, local, or both. Every engineer who joins a travel platform spends week two re-implementing something that was already wrong in the codebase about this.
Cancellation and change volume. A SaaS transaction is usually final. A booking transaction gets modified — on average, 30-40% of bookings have at least one post-booking modification (schedule change, traveler change, cancellation, refund, re-shop). The engineering surface isn't just "book a flight"; it's "book a flight, then change every field independently, then refund part of it, then rebook a related ancillary service."
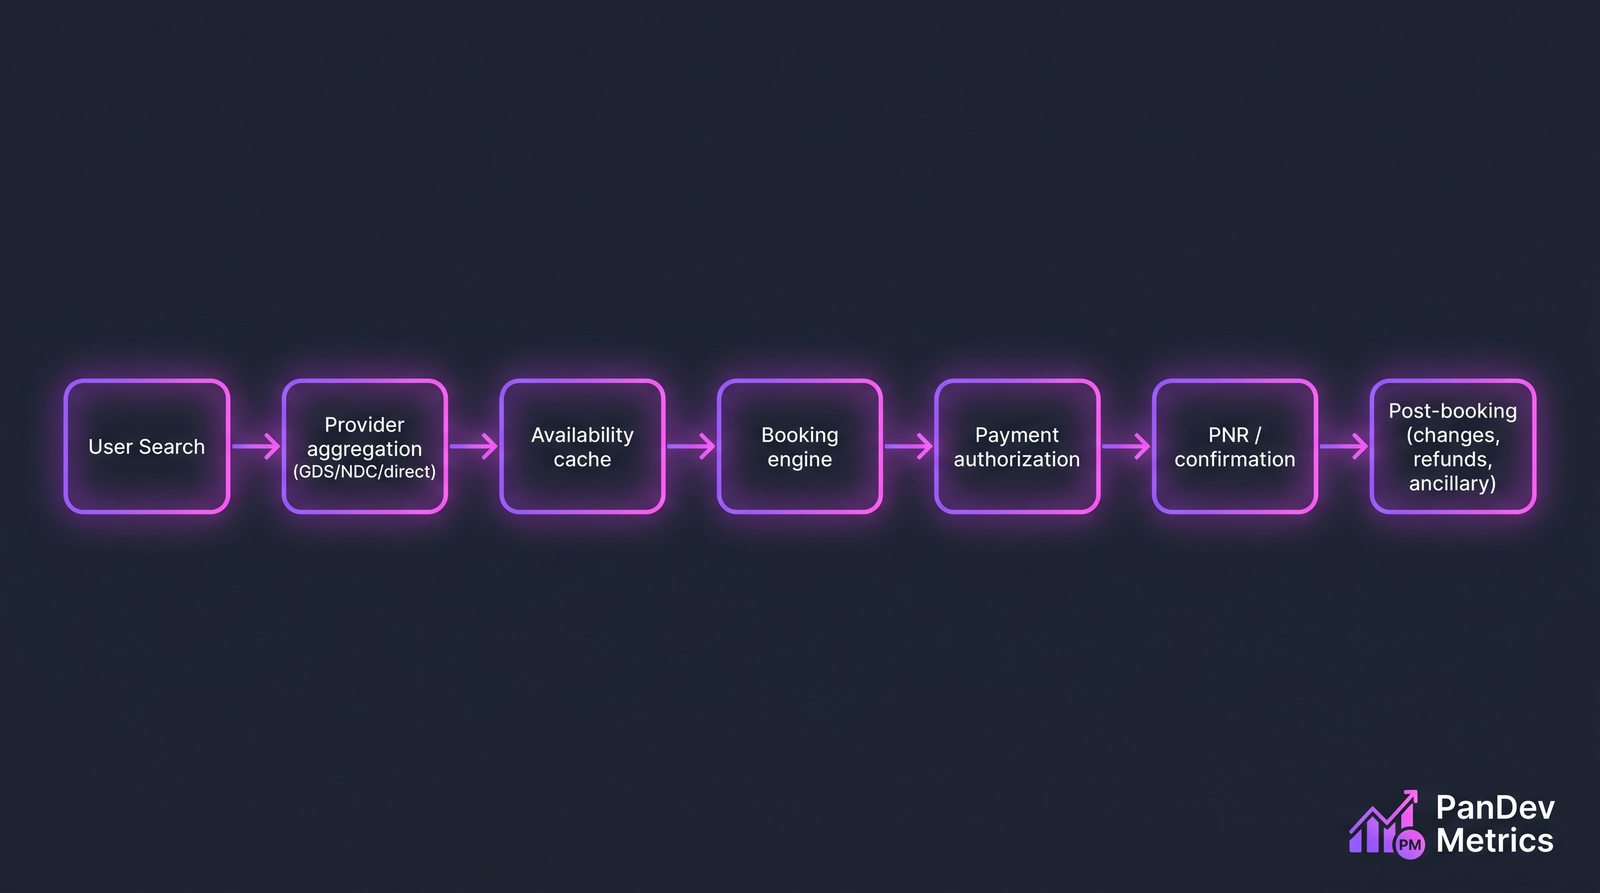 The "happy path" is 7 stages. Each one has its own failure modes, timeout windows, and compensating-transaction requirements.
The 5 metrics that matter
1. Look-to-book ratio (with search-response-time segmentation)
Standard e-commerce tracks conversion. Travel engineering tracks look-to-book — the ratio of distinct search sessions to completed bookings — segmented by search-response-time buckets. A fast site at the same booking rate as a slow site is wasting cache budget. A slow site with lower booking rate needs a latency investment.
| P95 search latency | Typical look-to-book for OTAs | Directional meaning |
|---|---|---|
| < 500ms | 3.5-5.5% | Healthy; cache layer earning its cost |
| 500ms-1s | 2.5-3.5% | Borderline; investigate tail latency |
| 1-2s | 1.5-2.5% | Underperforming; drop-off exceeds industry benchmark |
| > 2s | < 1.5% | Losing money on ad spend to send users to a slow page |
Hotel aggregator Trivago's SEC filings before the 2023 restructuring included look-to-book as a top-line metric. When theirs dropped below 2%, the business was structurally broken before the Q3 miss.
2. PNR reliability (the commit-success metric)
A PNR is the record that ties a traveler to a reserved itinerary. Creating one requires coordinated commits across your platform, the GDS, and (often) payment authorization. It can fail at any of those points, and partial failures are the hard case — you charged the card but the GDS rejected the seat map.
The engineering metric: what percentage of attempted bookings result in a confirmed PNR with matching downstream state (charged amount = itinerary price, email confirmation sent, mobile app updated)?
| Platform type | Good PNR-reliability | Red flag |
|---|---|---|
| Direct-connect (airline.com) | > 99.5% | < 99% |
| NDC-enabled aggregator | > 99% | < 98% |
| Traditional GDS aggregator | > 98.5% | < 97% |
| Meta-search (redirect-only) | N/A | Not applicable — redirect accounts for conversions |
The failure cases produce the highest-volume support tickets in travel. Engineering teams that invest in saga/compensating-transaction patterns around PNR creation see support-ticket volume fall 40-60% in the next quarter.
3. Peak-season deploy freeze discipline
Travel volume isn't uniform. Winter-holiday peak (November to mid-January for outbound leisure), summer peak (May to August for inbound European leisure), and local holidays (Chinese New Year, Russian Mayovka, Golden Week) produce traffic spikes of 8-15× baseline. The engineering practice is code-freeze during these windows on booking-path services.
| Service class | Freeze window length | What's allowed |
|---|---|---|
| Booking engine + PNR | 6-8 weeks | Only rollback-safe hotfixes with change-review |
| Search / inventory | 4-6 weeks | Feature-flagged changes, off by default |
| Payment integration | 8-10 weeks | Security patches only |
| Post-booking (changes, refunds) | 3-4 weeks | Full deploys allowed; capacity-scaled |
| Marketing / content | No freeze | Daily deploys expected |
Teams that skip this discipline end up with on-call rotations that burn out mid-season. DORA's "deploy frequency" metric reads as green even as the team is structurally unhealthy; our deployment frequency post argues for cadence, but travel is the industry where indiscriminate cadence actively hurts.
4. Cancellation-to-refund lead time
Most travel platforms under-instrument post-booking operations because the dashboard defaults to pre-booking funnel. The refund timeline is an engineering metric that customers absolutely notice:
| Refund stage | Typical duration | What blocks it |
|---|---|---|
| Cancellation request → GDS cancellation | < 2min | Retry logic against GDS outages |
| GDS confirmation → provider refund request | < 10min | Provider API reliability |
| Provider refund → acquirer settlement | 2-5 business days | Payment-processor batch schedules |
| Acquirer → customer bank | 3-10 business days | Bank processing (out of our control) |
The engineering-controlled portion is stages 1-3. Teams that instrument each stage independently and set per-stage SLAs ship faster refund flows and, measurably, retain customers at a higher rate on rebooking.
5. Concurrent-modification resolution rate
When a hotel room has one inventory unit left and two users try to book it at once, exactly one user gets it — but the other user's UI might have shown availability 200ms ago. Your system has to detect the race, refund cleanly if a charge happened, and present a coherent error path.
The metric: of all booking attempts that fail due to concurrent-modification / sold-out-during-checkout conditions, what percentage resolve without creating a support ticket? Good travel platforms sit at 85-95%. Platforms under 70% have structural race-condition handling problems; platforms near 100% probably don't detect the race at all (worse, quieter failure).
How scale and compliance shift measurement
PCI-DSS everywhere. Every travel platform processes card data. Scope reduction via tokenization is the main engineering investment — services that see raw PAN should be a countable list, not a default. Travel engineering dashboards should track PCI-scope surface area: the number of services / repositories / engineers with access to in-scope payment data. This number should trend down over time, not up.
EU / GDPR + local data-residency. Travelers' passport numbers, nationality, and frequent-flyer numbers are special-category data in most jurisdictions. Companies operating in Kazakhstan, Russia, China, Brazil, or Vietnam face localization requirements that often make multi-tenant SaaS engineering-metrics platforms non-starters. On-prem deployment becomes the default, not the exception, for B2B travel tech operating across these markets.
Supplier rate-limit discipline. GDSs and NDC APIs charge per query and throttle aggressively. Badly-tuned caching can cost seven figures per year in avoidable query fees. Engineering metrics that track "queries per successful booking" catch this earlier than any finance dashboard — typical healthy ratio is 30-80 search queries per completed booking; anything over 200 means cache layer isn't doing its job.
Case pattern: typical travel-platform engineering team
| Parameter | Typical range (2026) |
|---|---|
| Team size | 80-500 engineers for mid-size OTAs, 2,000+ for global aggregators |
| Tech stack | Java/Kotlin for booking core, Go or Node for edge services, React for web, Swift/Kotlin for mobile |
| Deploy cadence | Daily in off-season, weekly during freeze windows |
| Primary pressure | Search latency + PNR reliability + timezone/DST correctness |
| Integrations | Amadeus, Sabre, Travelport (GDS), NDC-aware aggregators, 50-200 direct hotel connections, 5-15 payment providers |
| Data sensitivity | PCI + PII (passport, DOB, FF numbers) — scope-reduced but unavoidable |
| Peak-to-trough ratio | 8-15× annual, 3-5× daily |
The contrarian take
Travel engineering leaders obsess over booking-path latency. The metric that actually compounds over years is cancellation-to-refund time. A traveler whose flight was cancelled and refunded in 48 hours tells their friends; a traveler whose refund took 6 weeks remembers it for a decade. Engineering investment in post-booking operations produces customer-retention improvements that show up in LTV models 18-24 months later — far past the patience window of most roadmap planning. Teams that stay disciplined on this metric end up with structural advantage over competitors who "couldn't justify the investment."
The honest limit
Our dataset has strong signal on ~20 travel and hospitality engineering teams, mostly in CIS markets and one EU aggregator. Global OTA / metasearch scale (Booking.com, Expedia Group, Trip.com) is outside our direct observation; benchmarks for those platforms above draw on published engineering blogs, earnings-call technical disclosures, and the Phocuswright industry dataset rather than IDE telemetry. Teams operating at that scale will see different shapes, particularly on PNR reliability and concurrent-modification rates, where their failure modes are dominated by multi-region state replication challenges we can't observe from the outside.
Where PanDev Metrics fits
Booking platforms at 80+ engineers tend to organize around service boundaries (search, booking, payment, post-booking) that require independent measurement. The IDE heartbeat approach distinguishes coding time on the booking-core services from work on edge services and post-booking operations — which helps EMs see whether the peak-season freeze is actually holding or whether "freeze" deploys are just happening in different repositories. The AI assistant can answer questions like "what percentage of this week's code changes touched PCI-scope services?" — the kind of compliance-adjacent visibility that manual dashboards rarely surface.
Related reading
- Engineering Metrics in Fintech: Compliance, Speed, and Security — overlapping PCI and payment-integration concerns, different failure modes
- E-Commerce: How to Accelerate Feature Delivery Before High Season — the seasonal-peak playbook that travel should learn from, with sharper freeze windows
- Marketplace Platform Engineering: Metrics for Two-Sided Products — adjacent two-sided dynamics for OTAs and meta-search
- External: IATA NDC adoption tracker — current standard-adoption state for airline distribution