Chrome
Install the PanDev Metrics extension in Google Chrome so that time spent on whitelisted web tools shows up in your dashboards. Takes about 2 minutes.
Before you begin
- Google Chrome installed
- A PanDev Metrics account
- Your PanDev Metrics API token — open the web app, go to Settings → Plugins, click any browser, and copy the value from the Enter your token step. Tokens start with
pandev_
Install
- Open the listing: PanDev Metrics on Chrome Web Store
- Click Add to Chrome, then Add extension to confirm
- Click the puzzle icon in the toolbar and pin PanDev Metrics so the icon stays visible
Authenticate
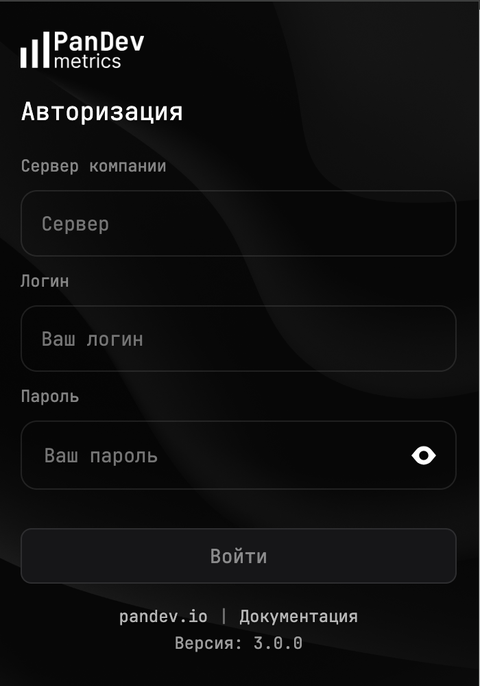
- Click the PanDev Metrics icon in the toolbar
- Paste your token and sign in
The server address and the workspace are inside the token, so there is nothing else to fill in. The same token works for the IDE plugins and the CLI.
Verify
- The extension icon shows a connected state
- Visit a whitelisted domain (e.g.
github.com) for at least 30 seconds - In the PanDev Metrics UI: Settings → Browser Settings lists your machine with a recent event timestamp
Troubleshooting
- No data? Check that the visited domain is on your tenant whitelist and not on your personal blacklist.
- Extension disabled? Open
chrome://extensions/and re-enable PanDev Metrics. - Wrong account? Sign out from the extension popup and paste a token copied from the right workspace.
Related
- Browser extensions overview — what's tracked, whitelist vs blacklist
- Install in Firefox
- Install in Edge