Key indicators in PanDev Metrics
TL;DR. PanDev Metrics shows three families of indicators on the dashboard: DORA (delivery health), productivity and engagement (where time goes), and AI coding (human-vs-model output). All of them are derived from the same event streams — plugin activity, Git, and the task tracker — refreshed on a cron, and stored without an expiry date. Custom metrics are intentionally not supported.
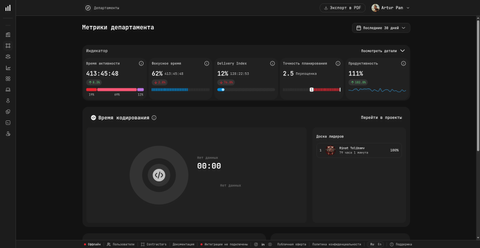
The department dashboard above shows all five productivity indicators at once: Время активности (Activity Time), Фокусное время (Focus Time), Delivery Index, Точность планирования (Planning Accuracy), and Продуктивность (Productivity) — plus a dedicated Время кодирования (Coding Time) card with a leaderboard. Each indicator shows an absolute value and a change versus the previous period.
Three families of indicators
A dashboard with thirty unrelated numbers is noise. PanDev Metrics groups indicators into three families that answer three different leadership questions.
| Family | Question it answers | Primary source |
|---|---|---|
| DORA | Is the team shipping software well? | Git provider + task tracker |
| Productivity & engagement | Where is engineering time actually going? | IDE / browser / CLI plugin events |
| AI coding | How much of our output is human vs model? | IDE plugin + AI tool integrations |
The rest of this page walks through each family, explains what the numbers mean, and notes the trade-offs PanDev Metrics has chosen.
DORA metrics
PanDev Metrics implements the four DORA metrics first introduced by the Google DORA program in the Accelerate State of DevOps Report. They measure the flow of software delivery, not the volume of work — high-performing teams are not necessarily the ones writing the most code.
| Metric | What it measures |
|---|---|
| Deployment Frequency | How often the team ships to production. |
| Lead Time for Changes | How long it takes from first commit to production. Broken into four stages: Coding / Pickup / Review / Deploying. |
| Change Failure Rate | The share of deployments that cause an incident or rollback. |
| Mean Time to Restore (MTTR) | How quickly the team recovers from a failed deployment or production incident. |
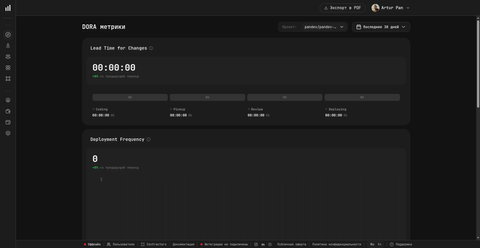
PanDev Metrics surfaces these in a dedicated DORA section of the dashboard, filterable by Project and Period, with performance bands (Elite, High, Medium, Low) shown next to each value. The bands follow the published DORA definitions, so a team can compare its number to the same band thresholds reported in the global DORA dataset.
The four Lead Time stages are visible directly on the dashboard, which makes Lead Time more actionable than a single aggregate number: a team can see whether time is being lost in Coding (raw development), Pickup (waiting for a reviewer), Review (review iterations), or Deploying (the pipeline itself).
DORA metrics are not calculated in real time. They are recomputed by a scheduled job that runs at 2:30 AM UTC — see Refresh cadence below — because the inputs (deployments, incidents, rollbacks) accumulate slowly and a per-minute recompute would mostly redo the same arithmetic. For the underlying definitions of "deployment", "production branch", and "failed deployment" in your tenant, see the DORA configuration in your organization settings; the conventions vary enough across companies that PanDev Metrics intentionally exposes them rather than hard-coding one shape.
Activity Time (Время активности)
Activity Time (UI label: Время активности) is the total time the system has observed real work from a person or team. It is not "hours the IDE was open"; it is the sum of intervals between consecutive plugin events where the gap is shorter than 15 minutes. Long gaps are dropped as breaks. See How the plugin works for the full mechanic.
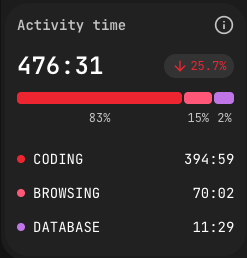
The indicator breaks down into:
- Coding — writing and editing inside the IDE.
- Browsing — corporate documentation, Jira, GitLab, and other allowlisted domains.
- Database — using DB tools inside or outside the IDE.
- Terminal — CLI activity, including git operations.
- AI — interacting with AI coding tools (prompts).
Activity Time is shown as HH:MM (for example, 181:09), with a percentage trend versus the previous period and a per-category breakdown. The split into five categories lets a manager spot, at a glance, whether the team's hours went into code, into context (docs, tickets), or into operations.
Focus Time (Фокусное время)
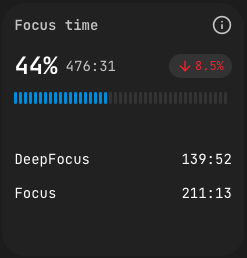
Focus Time (UI label: Фокусное время) measures sustained, uninterrupted work intervals. The dashboard splits it into two depths:
- Focus — continuous work on a single task with minimal context switching.
- DeepFocus — longer uninterrupted sessions, indicating deep-work capacity.
The card shows a percentage (focus time over total activity), an absolute value in HH:MM, a trend versus the previous period, and the Focus / DeepFocus split. Reading the split matters more than the headline number: a high overall Focus value with low DeepFocus suggests the team is concentrated but in short bursts; high DeepFocus suggests room for genuinely complex problem-solving.
Productivity (Продуктивность)
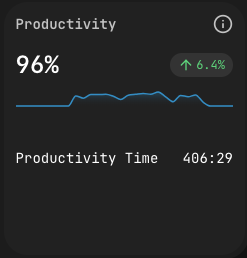
Productivity (UI label: Продуктивность) compares an engineer's pure coding time against a baseline target of 1 hour per day of focused coding. A value of 100% means the target was hit; on the department dashboard you may see numbers like 111% (slightly above target) or 132.1% (exceeded by a third), each with a change versus the previous period (for example +102%). The card includes a sparkline for the chosen period and a trend arrow versus the previous one.
The 1-hour baseline is not a quota — it is calibrated to the real shape of an engineering day, most of which is research, design, review, and conversation; the indicator is meant to catch the fact that real coding happened, not "did the person work a full day". Treating it as a quota inverts the signal: if developers chase the number, they game it. Treating it as a coverage indicator (did real coding actually happen?) preserves the meaning.
Planning Accuracy (Точность планирования)
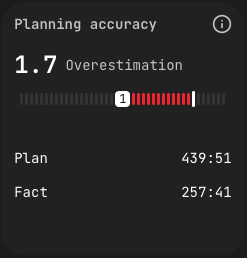
Planning Accuracy (UI label: Точность планирования) is the ratio between time planned on a task in the tracker and time actually recorded by the plugin. A coefficient of 1.0 is perfect; < 1.0 means the task took longer than estimated; > 1.0 means the task was faster. The card shows the coefficient, a visual scale, and the Plan-vs-Fact split — for example, on the department dashboard you may see a value labelled as 2.5 Переоценка ("overestimation"), meaning the task came in significantly under the plan.
The indicator is most useful in aggregate over many tasks — single-task accuracy is noisy. Over a quarter, the distribution reveals whether estimation is systemically optimistic, pessimistic, or well-calibrated.
Coding Time (Время кодирования)
The department dashboard also surfaces Coding Time (UI label: Время кодирования) as a separate card with a per-engineer leaderboard (Доска лидеров). Where Activity Time covers the full breadth of activity — coding, browsing, terminal, AI, database — Coding Time isolates pure IDE editing. The leaderboard ranks engineers by Coding Time across the chosen period so a department lead can see, at a glance, who is currently writing the most code.
It is not a competition metric. Treating Coding Time as a quota inverts its meaning in the same way as Productivity (see above): if engineers chase the rank, they stop reviewing, pairing, or thinking, which are also part of the job. The leaderboard is a distribution view, not a ranking one — useful to spot outliers in either direction.
CLI metrics
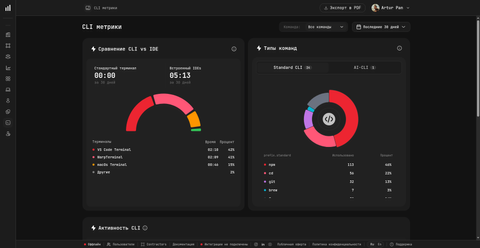
The CLI metrics card pulls the same event stream described in How the plugin works and answers two questions: where engineers are running commands (the terminal mix — e.g. VS Code Terminal 42%, WarpTerminal 41%, macOS Terminal 15%) and what kind of commands they run (split into Standard CLI and AI-CLI counts). The card surfaces real command names captured by the CLI agent — npm, cd, git, brew, and so on — never the arguments, flags, or output.
In practice this is how a manager spots, for example, that an engineer has moved to an AI-augmented terminal flow, or that the team is split across three different terminal apps when standardising on one would simplify support.
Delivery Index
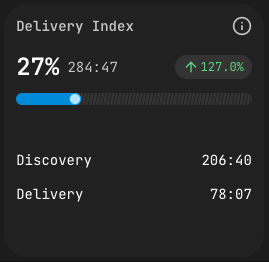
Delivery Index asks a sharp question: of the time spent on a feature branch, how much landed in the merge request?
PanDev Metrics tracks time per file. After the merge request is created, every file is classified:
- Delivery time — time spent on files included in the MR.
- Discovery time — time spent on files that were not.
The index is the ratio of Delivery to total. High Delivery means the team's exploration converged tightly on what shipped. Low Delivery means a lot of work went into spikes, experiments, or code that ended up discarded — which is sometimes correct and sometimes a signal of unclear scope.
AI coding tracking
PanDev Metrics tracks two AI-related counters separately because they answer different questions.
| Counter | Meaning |
|---|---|
| AI prompts (developer activity) | Time the engineer spends interacting with an AI tool — writing prompts, reviewing suggestions. Counted as part of the engineer's hours. |
| AI-generated output (agent mode) | Time and work produced when the AI runs as an agent — editing files, navigating the repo, executing commands on its own. Inline completions and autocompletes are not included. |
The split lets a team see how its human-to-model ratio is shifting over time without those two streams contaminating each other. It also makes "engineering hours" still mean engineering hours, even when half the team is using Copilot or Cursor.
Cost calculation
Cost per task is computed directly from the data PanDev Metrics already has: time tracked × hourly rate of the engineer.
Cost of a task = (time the engineer spent on the task) × (engineer's hourly rate) + a proportional share of the engineer's unattributed working time.
Unattributed time is plugin-recorded activity that could not be linked to a specific task (because the branch didn't follow a convention, or the work happened outside a branch). PanDev Metrics spreads it proportionally across that engineer's attributed tasks so the totals match the engineer's actual paid hours. The result is a cost view at the task, project, and department level that reflects real time, not story-point fiction.
Costs are reported in USD only — PanDev Metrics does not handle currency conversion. Salaries can be configured as hourly or monthly per employee.
Overtime
PanDev Metrics defines overtime simply: any activity recorded outside an employee's working hours on a working day. Weekends and holidays follow the company calendar plus the employee's individual schedule, and the personal schedule wins where the two disagree. There is no "after 6 PM" hard-coded rule — the boundary is whatever the employee's configured working hours say.
Organization model: projects, departments, teams
Three structural concepts surface across every indicator on the dashboard.
| Concept | Definition |
|---|---|
| Project | A Git repository. One repo, one project. |
| Department | A top-level unit in the organization tree. |
| Team | A unit nested inside a department. |
Indicators can be filtered by any of these, and a person can belong to a team without disappearing from the parent department's roll-up.
Refresh cadence
Indicators on the dashboard are recomputed on a schedule, not on every event arrival. After each scheduled cron job — the DORA recompute runs at 2:30 AM UTC — PanDev Metrics rebuilds the relevant materialized views and propagates the new aggregates into the dashboard.
The trade-off is deliberate: a per-event refresh would dominate database load without changing the numbers a viewer actually sees. The cron interval is short enough that the dashboard stays useful for daily and weekly decisions, and long enough that complex aggregates (DORA, Delivery Index) run efficiently.
Data retention
PanDev Metrics keeps all collected data indefinitely. There is no built-in retention or purge policy. The reasoning is straightforward: month-over-month and year-over-year trends are some of the most useful comparisons for engineering leaders, and a retention cutoff would silently break them. If your organization needs deletion for compliance reasons, talk to PanDev Metrics support — deletion is operational, not a product feature.
Custom metrics
PanDev Metrics does not support customer-defined metrics or formula editors inside the product itself — the set of indicators on the dashboard is fixed.
The reasoning is twofold. First, every custom metric becomes a maintenance contract — schemas, refreshes, performance, naming — and a small number of well-tuned indicators consistently beats a long tail of bespoke ones. Second, the indicators on offer cover the leadership questions PanDev Metrics has tested across its tenant base; the pressure to add a "just one more KPI" is usually a sign that the existing ones are not being read closely enough yet.
Need your own slices? PostgreSQL underneath
Under the hood, PanDev Metrics stores everything in plain PostgreSQL 17 — both in Cloud and on-prem. With agreement from the team, read-only access can be granted to selected tables and views, and any company can:
- Pipe data into their own warehouse (BigQuery, ClickHouse, S3) and build analytics there
- Point Power BI, Tableau, Grafana, Metabase, or Superset straight at Postgres and assemble their own dashboards and reports
- Run ad-hoc SQL against the marts — a dedicated analyst keeps the flexibility the in-product UI does not offer
In other words: the fixed indicator set is a product-surface choice, not a data boundary. Inside PostgreSQL you have full freedom of interpretation.
FAQ
How often are dashboard indicators refreshed?
Indicators are recomputed on scheduled cron jobs, which rebuild PanDev Metrics' materialized views and feed the updated aggregates into the dashboard. The cadence is short enough for daily and weekly use, but indicators are not real-time and were never intended to be. DORA in particular accumulates slowly enough that a real-time recompute would be wasteful.
Can I add a custom metric or formula?
No. PanDev Metrics intentionally ships a fixed indicator set, tuned across many tenants, rather than a metric editor. If a metric matters to multiple customers, it gets added to the product. One-off metric requests are not supported; the typical answer is to surface the underlying events in a way that an existing indicator covers the question.
How long is my data kept?
Indefinitely. PanDev Metrics has no retention policy or auto-purge, because trend lines across years are one of the most useful views for engineering leaders. If you need data removed for compliance, the operations team can do it manually — there is no product control for it.
How does the cost of a task get computed?
PanDev Metrics multiplies the time recorded on a task by the engineer's hourly rate, then adds a proportional share of that engineer's unattributed working time. The split ensures the sum of task costs equals the engineer's actual paid hours rather than only the cleanly attributed ones. All amounts are in USD.
What counts as overtime?
Any activity captured during a working day outside the employee's configured working hours. Personal schedules override the company-wide calendar where they differ. Weekends and holidays follow the calendar plus the personal schedule. The plugin does not enforce a working-hours window; it just records, and the dashboard classifies after the fact.
Is a "project" the same as a repository?
Yes. PanDev Metrics treats one Git repository as one project. Multi-repo features are grouped at the department or team level, not by collapsing repos into a single project entity.
What is the difference between a team and a department?
Departments are top-level units in the organization tree; teams are nested inside departments. An engineer belongs to a team, which belongs to a department, which belongs to the tenant. Indicators can be filtered or rolled up at any of these levels.
Related
- Concept: How the plugin works — where the events come from.
- Concept: Product overview
- Concept: PanDev Metrics features