The 2023 Stack Overflow Developer Survey reported that developer satisfaction directly predicts retention and output quality. Meanwhile, DORA metrics predict organizational performance. And yet many engineering leaders treat these as competing approaches rather than complementary lenses. In 2026, the problem isn't lack of frameworks — it's choosing the right combination. DORA, SPACE, and DevEx each claim to measure "developer productivity." None of them measures the same thing.
Here's how to cut through the noise.
The Three Frameworks at a Glance
Before comparing, let's establish what each framework actually is and where it came from.
DORA Metrics
Origin: The DevOps Research and Assessment (DORA) team, originally independent, acquired by Google in 2018. Based on 10+ years of research across tens of thousands of organizations.
Published in: Accelerate: The Science of Lean Software and DevOps (2018) by Nicole Forsgren, Jez Humble, and Gene Kim. Updated annually in the State of DevOps Report.
What it measures: Software delivery performance — how quickly and reliably an engineering team delivers changes to production.
The four metrics:
| Metric | Measures | Direction |
|---|
| Deployment Frequency | How often you deploy to production | Higher is better |
| Lead Time for Changes | Time from commit to production | Lower is better |
| Change Failure Rate | % of deploys causing failures | Lower is better |
| Mean Time to Restore (MTTR) | Recovery time from failures | Lower is better |
Strengths: Objective, measurable from system data (no surveys needed), well-researched, industry-standard benchmarks.
Limitations: Only measures the delivery pipeline. Doesn't capture developer experience, collaboration quality, or whether the team is building the right things.
SPACE Framework
Origin: Nicole Forsgren (again), Margaret-Anne Storey, Chandra Maddila, Thomas Zimmermann, Brian Houck, and Jenna Butler. Published in 2021.
Published in: ACM Queue (March 2021), "The SPACE of Developer Productivity."
What it measures: Developer productivity across five dimensions. SPACE is an acronym:
| Dimension | What It Covers | Example Metrics |
|---|
| Satisfaction and well-being | How developers feel about their work | Survey: job satisfaction, burnout risk |
| Performance | Outcomes of the work | Quality, reliability, customer impact |
| Activity | Observable actions | Commits, PRs, deployments, code reviews |
| Communication and collaboration | How people work together | Review turnaround, knowledge sharing, meeting load |
| Efficiency and flow | Speed and interruptions | Flow state frequency, wait times, handoff delays |
Strengths: Holistic view, combines quantitative data with surveys, explicitly warns against using metrics for individual evaluation.
Limitations: Requires surveys (ongoing cost), many metrics are subjective, harder to benchmark across organizations, no standard implementation.
DevEx Framework
Origin: Abi Noda, Margaret-Anne Storey, Nicole Forsgren, and Michaela Greiler. Published in 2023.
Published in: ACM Queue (April 2023), "DevEx: What Actually Drives Productivity."
What it measures: The lived experience of developers across three dimensions:
| Dimension | What It Covers | Example Metrics |
|---|
| Feedback loops | How quickly developers get responses | CI speed, code review turnaround, deployment time |
| Cognitive load | Mental effort required to do the work | Codebase complexity, documentation quality, number of tools |
| Flow state | Ability to focus and make progress | Interruptions per day, meeting-free blocks, context switches |
Strengths: Developer-centric, research-backed, focuses on actionable dimensions that engineering leaders can directly influence.
Limitations: Primarily survey-based, newer (less longitudinal data), no established industry benchmarks.
The Key Differences
What They Measure
These frameworks measure fundamentally different things:
| Framework | Measures | Analogy |
|---|
| DORA | Output of the delivery system | Car speedometer and fuel efficiency |
| SPACE | Multiple dimensions of productivity | Full vehicle diagnostic dashboard |
| DevEx | The driver's experience | Driver comfort and ergonomics survey |
DORA answers: "How fast and reliably does our pipeline deliver software?"
SPACE answers: "How productive is our engineering organization across multiple dimensions?"
DevEx answers: "How do our developers experience their daily work?"
Data Sources
| Framework | Primary Data Source | Survey Required? | Automation Level |
|---|
| DORA | System data (Git, CI/CD, incident tracking) | No | Fully automatable |
| SPACE | Mixed (system data + surveys) | Yes | Partially automatable |
| DevEx | Primarily surveys + some system data | Yes | Mostly manual |
This difference matters operationally. DORA metrics can be computed entirely from system data — no surveys, no manual input, no quarterly data collection exercises. You connect your Git provider and CI/CD system, and you have metrics immediately.
SPACE and DevEx require ongoing survey programs. Surveys need to be designed, distributed, collected, and analyzed. Response rates matter. Question phrasing affects results. Survey fatigue is real. This creates operational overhead that DORA avoids.
Research Foundation
| Framework | Years of Research | Sample Size | Predictive Validity |
|---|
| DORA | 10+ years (2014–present) | 36,000+ professionals | Proven: predicts organizational performance |
| SPACE | 3+ years | Research-backed but smaller empirical base | Theoretical framework, validated dimensions |
| DevEx | 2+ years | Research-backed, industry surveys | Emerging validation |
DORA has the strongest empirical foundation. The research, led by Nicole Forsgren and published through Google Cloud, has demonstrated statistically significant links between DORA metrics and organizational outcomes (profitability, market share, customer satisfaction). Notably, the SPACE framework was co-authored by Forsgren as a deliberate extension of DORA's scope, not a replacement. DevEx, published in ACM Queue by Noda, Storey, Forsgren, and Greiler, is conceptually sound and research-backed but has less longitudinal validation.
When to Use Each Framework
Use DORA When:
You need to measure and improve your delivery pipeline. DORA is unmatched for answering "how fast and reliably do we ship software?"
You want objective, automated metrics. No surveys, no opinions — just data from your systems.
You need industry benchmarks. DORA's Elite/High/Medium/Low benchmarks let you compare against the industry.
You're reporting to executives or boards. DORA's four metrics are simple enough for non-technical stakeholders to understand. "We deploy 3x per day with a 10% failure rate and 45-minute recovery time" is a sentence a CFO can process.
You're a team of any size. DORA scales from a 5-person startup to a 5,000-person enterprise.
Use SPACE When:
You suspect your delivery metrics are fine but something is still wrong. If DORA numbers look good but developers are burned out, turnover is high, and morale is low, SPACE captures what DORA misses.
You're managing a large engineering organization. SPACE's breadth is useful at the VP/CTO level when you need to understand productivity across dozens of teams with different contexts.
You want to measure collaboration quality. DORA doesn't directly measure how well people work together. SPACE's Communication dimension fills this gap.
You have the operational capacity for ongoing surveys. SPACE requires survey infrastructure and someone to manage the program.
Use DevEx When:
Developer retention is a priority. DevEx directly measures the factors that make developers want to stay or leave: cognitive load, flow state, feedback loops.
You're investing in developer tooling. If you're spending money on internal platforms, developer portals, or toolchain improvements, DevEx surveys measure whether developers feel the impact.
You want to identify friction points. DevEx's focus on cognitive load and flow state is excellent for finding the specific annoyances (bad documentation, slow CI, too many meetings) that make daily work painful.
The Case for Combining Frameworks
These frameworks are not competitors. They measure different things and complement each other naturally.
A practical combination for most organizations:
Tier 1: DORA (Always On)
Automate DORA metrics collection from day one. These are your continuous, objective delivery metrics. Track them weekly, display them on team dashboards, review them in retrospectives.
DORA gives you the "what" — what is our delivery performance right now?
Tier 2: DevEx Surveys (Quarterly)
Run a focused DevEx-style survey quarterly. Keep it short (15–20 questions). Focus on:
- Feedback loop speed (CI, code review, deployment)
- Cognitive load (complexity, documentation, tooling)
- Flow state (interruptions, meetings, context switches)
DevEx gives you the "why" — why is delivery performance the way it is?
Tier 3: SPACE Dimensions (Annual Deep Dive)
Once a year, conduct a comprehensive assessment that includes SPACE's broader dimensions: satisfaction, well-being, collaboration, and performance outcomes.
SPACE gives you the "where" — where should you invest next year?
How They Feed Each Other
| DORA Shows | DevEx Explains | SPACE Adds Context |
|---|
| Lead Time is increasing | "CI takes 35 minutes and I have to wait for it" | Satisfaction is dropping; engineers feel blocked |
| Deployment Frequency plateaued | "I spend 3 hours/day in meetings, can't finish features" | Collaboration overhead is high; too many ceremonies |
| Change Failure Rate is rising | "The codebase is too complex, I can't understand the impact of changes" | Knowledge sharing is low; no documentation culture |
| MTTR is high | "I don't know which team owns which service" | Communication channels are unclear; no ownership map |
Common Mistakes
Mistake 1: Choosing One Framework and Ignoring the Others
"We use DORA, so we don't need to measure developer experience." This leads to optimizing delivery metrics while developers burn out. You can have elite DORA numbers and 30% annual turnover. That's not sustainable.
Mistake 2: Measuring Everything at Once
"We'll implement all three frameworks this quarter." This overwhelms teams with metrics, surveys, and dashboards. Start with DORA (automated, low overhead), add DevEx surveys after you've established a baseline, and explore SPACE dimensions when you're ready for a comprehensive assessment.
All three frameworks explicitly warn against this. DORA metrics are team-level delivery indicators. SPACE dimensions are organizational health signals. DevEx measures are experience indicators. Using any of them to rank individual developers creates perverse incentives, gaming, and distrust.
Mistake 4: Survey Fatigue
If you run SPACE and DevEx surveys monthly, response rates will drop below 30% within two quarters. Quarterly is the right cadence for most organizations. Annual for comprehensive assessments.
Mistake 5: Ignoring the Framework That Challenges You
If DORA metrics look great, you'll be tempted to dismiss DevEx findings that say developers are unhappy. If DevEx scores are high, you'll be tempted to ignore DORA metrics showing you deploy once a month. Each framework reveals blind spots. That's the point.
The 2026 Landscape
Several trends are shaping how these frameworks are used in 2026:
AI-assisted development changes the math. With AI coding assistants reducing Coding Time, the relative importance of Pickup Time and Review Time (DORA) increases. DevEx's "cognitive load" dimension becomes critical — AI generates code fast, but developers still need to understand and review it.
Platform engineering makes DORA metrics easier to collect. Internal developer platforms increasingly provide DORA metrics out of the box. The barrier to adoption is lower than ever.
Remote work makes DevEx more important. In distributed teams, friction that was invisible in an office (waiting for a reply, unclear ownership, poor documentation) becomes measurable and impactful. DevEx surveys surface these issues.
Regulatory pressure increases demand for DORA. Industries like fintech, healthcare, and government increasingly require evidence of software delivery maturity. DORA metrics provide that evidence. (The EU's Digital Operational Resilience Act — also called DORA, confusingly — drives interest in the DevOps DORA metrics as a way to demonstrate operational maturity.)
Practical Recommendations by Role
For CTOs
Start with DORA. It's objective, automated, and speaks the language of business outcomes. Add DevEx surveys quarterly to understand developer satisfaction and retention risk. Use SPACE dimensions for annual strategic planning.
For VPs of Engineering
Implement DORA across all teams. Use it for identifying teams that need support (not punishment). Layer DevEx surveys to understand whether DORA improvements are translating into better developer experience.
For Engineering Managers
DORA is your weekly operating metric. Use it in retrospectives. DevEx feedback from your team tells you what to fix. Don't try to implement SPACE at the team level — it's designed for organizational assessment.
Focus on DORA. Your job is the delivery pipeline, and DORA measures exactly that. Use DevEx data to prioritize which parts of the pipeline to improve (developers will tell you whether CI speed or deployment complexity is the bigger pain point).
How PanDev Metrics Fits In
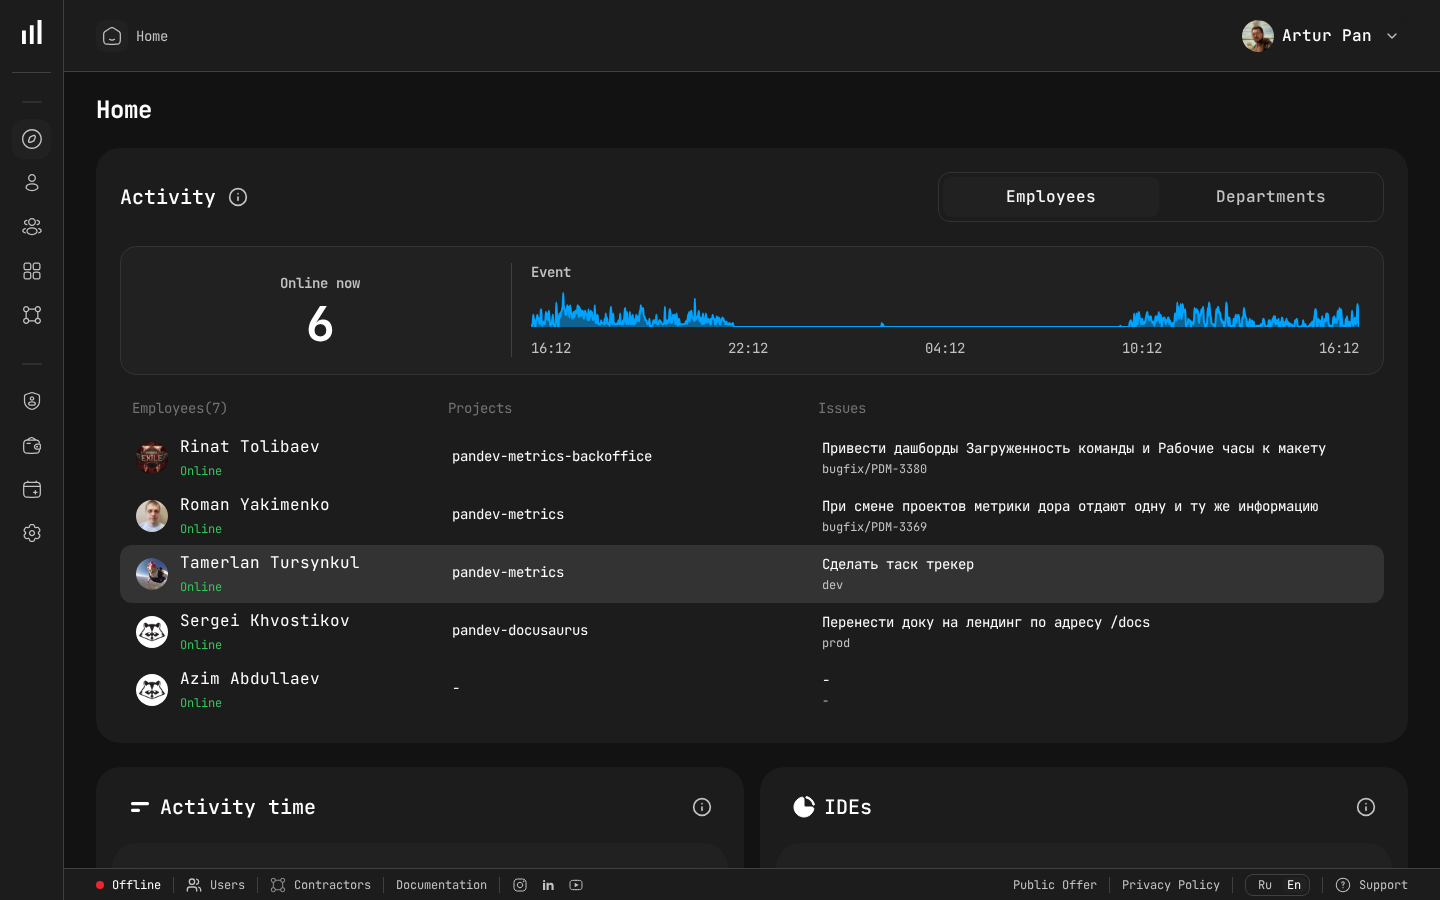
PanDev Metrics is a DORA-first platform. We automate collection of all four DORA metrics from your Git provider (GitLab, GitHub, Bitbucket, Azure DevOps) and project tracker (Jira, ClickUp, Yandex.Tracker). Lead Time is broken into four stages (Coding, Pickup, Review, Deploy) for actionable insights.
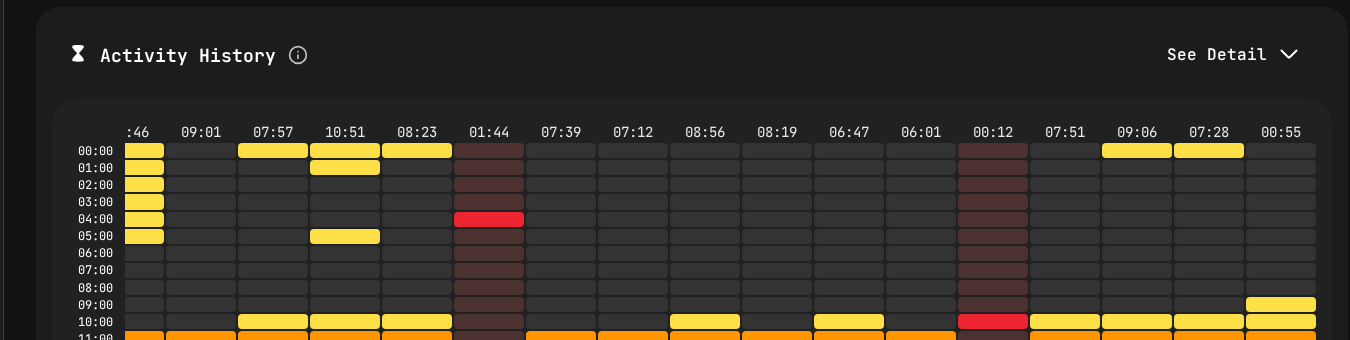
We complement DORA with IDE heartbeat tracking from 10+ plugins (VS Code, JetBrains, Eclipse, Xcode, Visual Studio, and more) — bridging into DevEx territory by measuring actual developer activity, not just pipeline events. This gives you data on cognitive load proxies (context switches, multi-repo work) and flow state indicators (uninterrupted coding blocks) without requiring surveys.
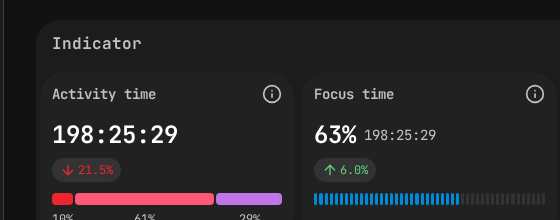
Activity Time and Focus Time indicators — SPACE framework dimensions measured automatically.
The built-in AI assistant (powered by Gemini) analyzes your metrics, identifies patterns, and suggests interventions — combining the objectivity of DORA data with the contextual intelligence that SPACE and DevEx frameworks emphasize.
Framework sources: DORA State of DevOps Reports (2014–2023); "The SPACE of Developer Productivity" (ACM Queue, 2021); "DevEx: What Actually Drives Productivity" (ACM Queue, 2023).
Start with what you can automate. PanDev Metrics gives you DORA metrics from day one — no surveys, no manual data collection, no spreadsheets. Get started →
]]>
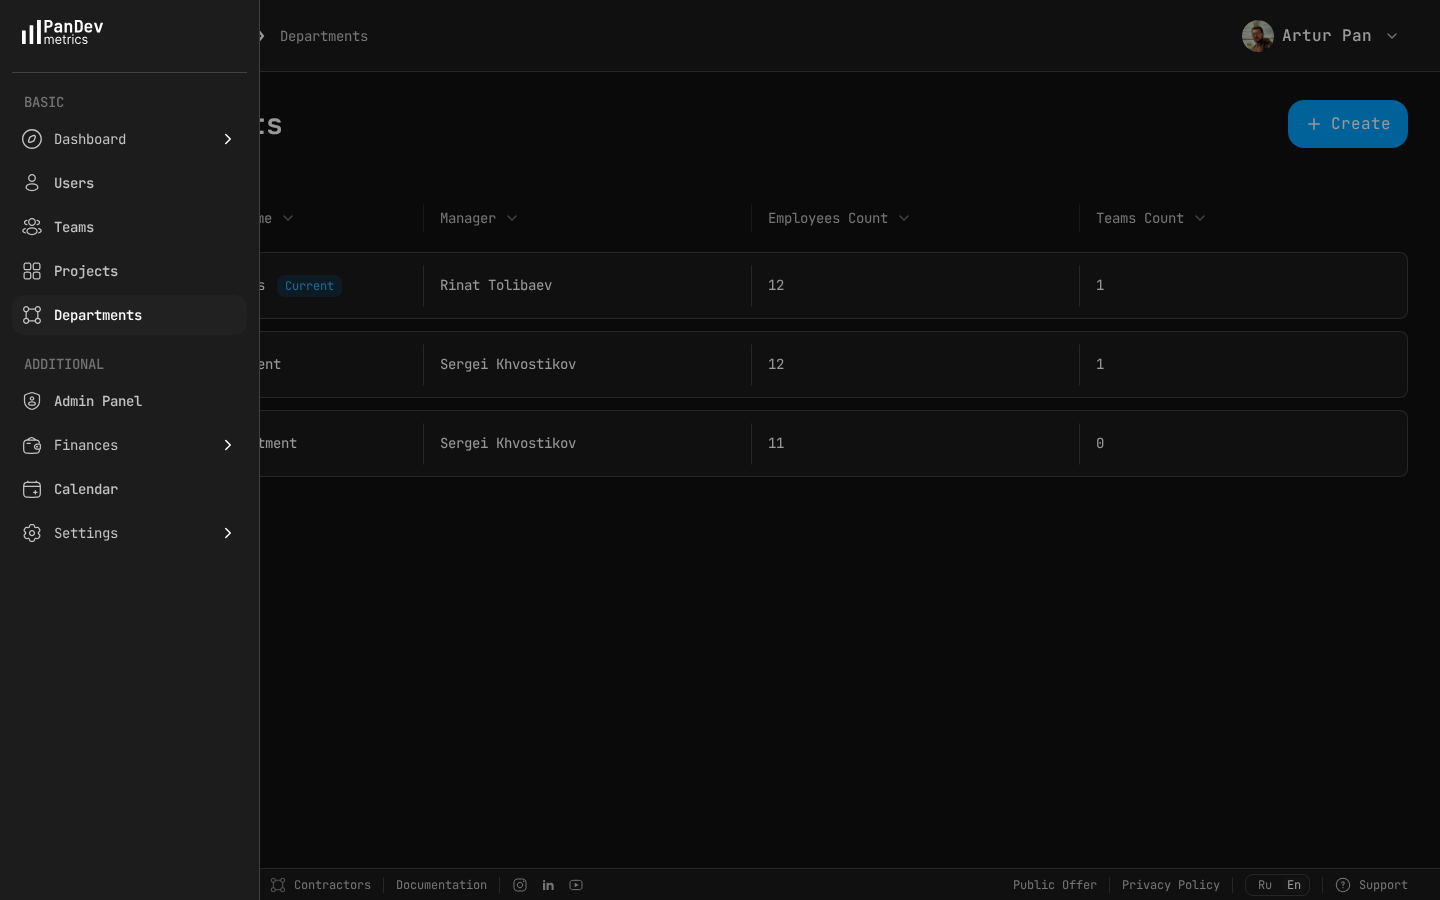 PanDev Metrics departments view — see how teams are structured, who manages each department, and where headcount is distributed.
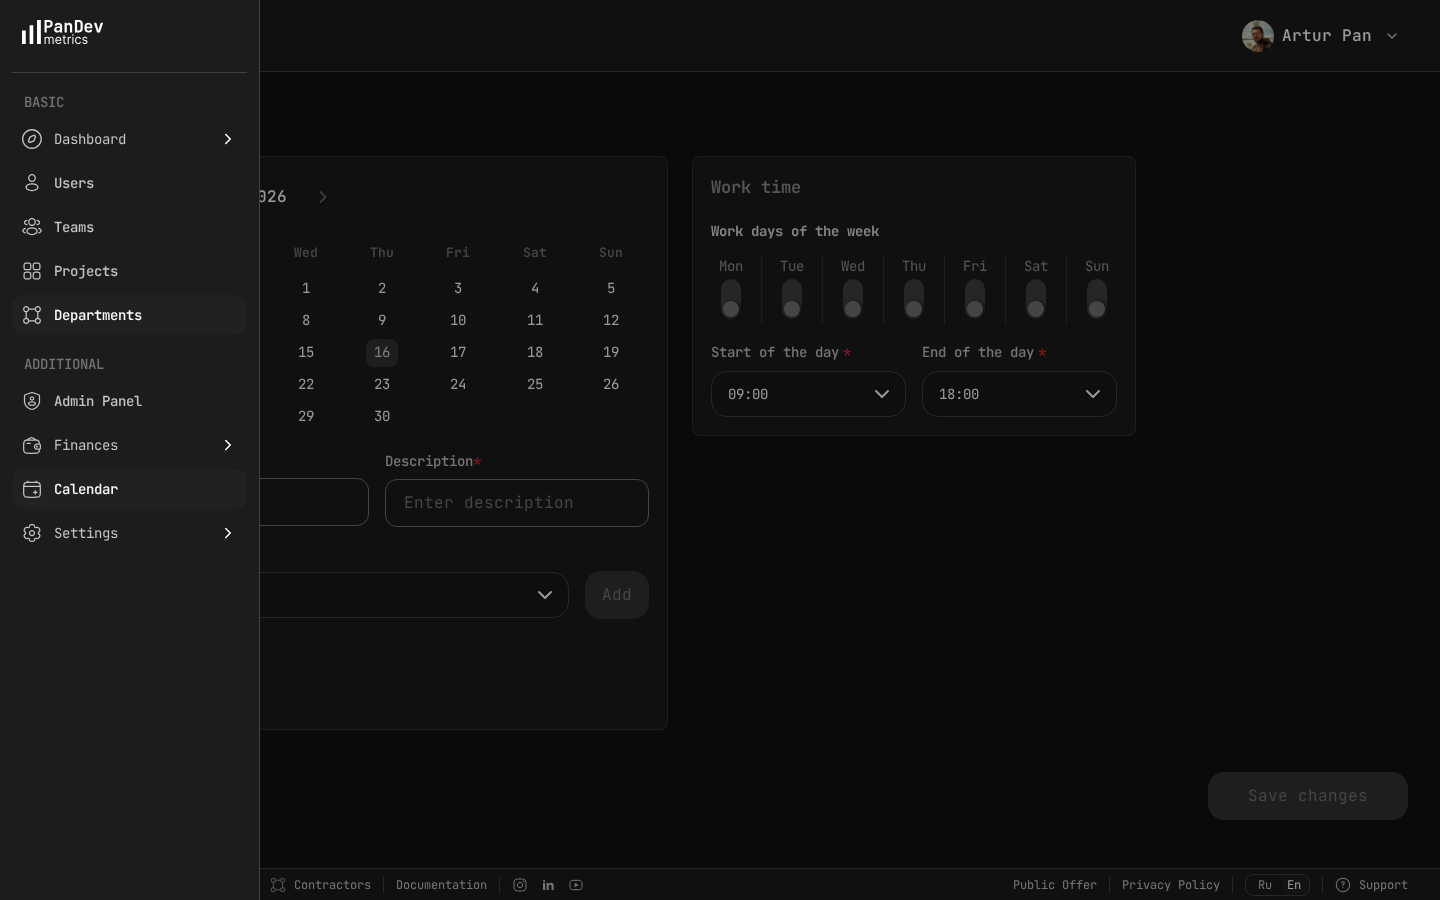 PanDev Metrics calendar settings — define standard work days (Mon-Fri) and hours (09:00-18:00) so the system can flag after-hours and weekend activity as potential burnout signals.